
1. Innledning
2. Klima som politikk
3. Stammetenkning og psykologi
4. Kildekritikk og kritisk tenkning
5. Den Vitenskapelige Metode
6. De beste bevisene for menneskeskapt global oppvarming og at det er C02 som er hovedårsaken
7. De vanligste klimamytene
8. Konsensus
9. Konsekvenser av klimaendringer
10. Klimaløgnmakernes taktikker, konspira, junk science, stigmatiserte kunnskap og uærlige budbringere
11. The Great Global Warming Swindle-filmen
11. The Great Global Warming Swindle-filmen
INNHOLD DEL 3
12. Klimarealistene
13. Alle klimaløgners mor - Tankesmien The Heartland Institute
14. Tilbake til Klimarealistene
15. PragerU og kreasjonisten bak
16. Klimarealistene anmelder bok
17. Konklusjon så langt
12. Klimarealistene
13. Alle klimaløgners mor - Tankesmien The Heartland Institute
14. Tilbake til Klimarealistene
15. PragerU og kreasjonisten bak
16. Klimarealistene anmelder bok
17. Konklusjon så langt
18. Klimafornekting i en konspirasjonskultur
19. Klimafornektingens røtter
20. Klimafornekting fra fossil brensel-industrien og hvordan den kopierer tobaksindustriens metoder
21. Sponsorene - den enorme pengestøtten bak klimaløgnene og taktikkene som brukes for å spre dem
22. Krigen mot vitenskapen
23. Kreasjonistene
24. Klima-kreasjonistene
25. Oppsummering
26. Avslutning
27. Bonus.
28. Faktaverktøy / Linker
Det er mye myter og løgner om klima i sosiale medier for tiden. De er -som alltid- veldig uvitenskapelige, enerverende og repeterende. Det er de samme løgnaktige grafene, den samme stigmatiserte kunnskapen resirkulert. Disse sakene, som oftest føleri eller synsing i en blogg, har gjerne gått sin runddans i klimaskeptikernes ekkokamre før de postes "uskyldig" i diverse grupper her på Facebook i forsøk på å alminneliggjøre disse oppfatningene. For å se hvordan “vanlige mennesker” reagerer på dem. Skape inntrykk av at det er en diskusjon om mennesker bidrar til klimaendringer. Men, det er ingen diskusjon om mennesker bidrar til klimaendringer. Det er kun forsøk på falsk balanse. Vi setter oss ikke til bords med Flat Earth Society for å "diskutere" om jorden er rund eller flat, på samme måte som vi heller ikke diskuterer evolusjon vs kreasjonisme med kreasjonister. Tror du at Jorden er flat, er du ikke skeptiker. Du er en realitetsfornekter. Tror du at NOAA (National Oceanic and Atmospheric Administration), NASA og Fns Klimapanel (IPPC) manipulerer data og at klimaforskere i 120 år har jukset for å skape en falsk “klimakrise”. Da er du ikke skeptiker. Du er en paranoid konspirasjonsteoretiker. Denne bloggen er resultatet av 2 års gjennomgang av klimaforskning, IPPC-rapporter, fagfellevurderte studier, avisartikler, innlegg, blogger og hundrevis av youtube-videoer. Og uendelige mange timer med diskusjoner i sosiale medier og andre steder.
Her finner du de beste tilgjengelige beviser for at mennesker bidrar til endringer i klimaet og at vårt C02-forbruk bidrar til global oppvarming. Til drivhuseffekten. Rett og slett ved å vise til den beste oppdaterte vitenskapen, forsket frem av dem som kan klima, nemlig klimaforskerne. Jeg linker til fagfellevurdert vitenskap, eller folk som gjør det samme, hele veien. (Kredible nettesteder og faktasjekkere blir listet opp aller sist i dette dokumentet.) Forskerne er like sikre på at menneskers forbruk av C02 bidrar til drivhuseffekten, som de er på at tobakksrøyking øker risikoen for hjerte og lungesykdommer. Som vi skal se, er disse bevisene egentlig enkle å fremskaffe. Alt som trengs er observasjoner fra klimavitenskapen og elementær kjemi og fysikk. Her er og svar på hvor klimaskepsis kommer fra, hvem som tjener på den og holder den i live, og hvordan klimafornekting ofte er vevd sammen med religion og politisk agenda. Klimaskepsis synes å være et av varemerkene til politisk populisme. Og enda verre, mørke konspirasjonsteorier. Vi skal se at mange av de samme folkene og kreftene som før i tiden fortalte oss at tobakksrøyking ikke var helsefarlig, i dag forteller oss at co2-utslipp fra menneskers bruk av fossile brensler ikke bidrar til økende drivhuseffekt. Så godt som all feilinformasjon om klima kommer i dag fra amerikanske tankesmier og lobbygrupper. Disse pakker fossil-brensel selvinteressene de reperesenterer inn i ideologi, politikk og religion. Disse kreftene er svært aggressive og “flinke” til å spre missinformasjon for å skape usikkerhet og skepsis blant befolkningen. For å etablere denne alternative virkeligheten må disse kreftene se totalt bort i fra all seriøs klimaforskning. Bevisene for dette er, som vi skal se, ganske udiskutable og skremmende.
Norge er en oljenasjon, det vet vi, og vi kommer til å være det en stund til. Det har skapt velstand og arbeidsplasser for mange, og teknologi og utvikling her og ute. Det er ingen som sier at vi alle skal gå over til kun fornybar energi i morgen. Poenget er at vi ikke kan lyve om miljø og klima. Alt vi forlanger er at vi får servert fakta om menneskeskapte klimaendringer og miljørisikoer. Dette dokumentet handler mest om løgner og uærlighet. Og litt om kritisk tenking og kildekritikk. Og, bare for å få sagt det, Klimaendringer er ikke dommedag. “Ord som «klimahysteri» og «skremselspropaganda» dukker ofte opp i klimadiskusjoner. Advarslene fra forskere er alvorlige, men det er også viktig å få frem at forskningen ikke forutsier et Hollywoodsk dommedagsscenario. [...] Jo tidligere vi klarer å slutte å forsterke drivhuseffekten, jo mindre blir endringene, og jo mindre vil vi måtte tilpasse oss. Klimasaken handler, i bunn og grunn, om mat, sikkerhet og økonomi. “
INNLEDNING
For de fleste av oss kom dessverre Anthropogenic Global Warming , eller AGW (menneskeskapt global oppvarming) inn i vår hverdag og bevissthet, ikke som vitenskap, men som politikk.

Brian Dunning, som driver den prisvinnende vitenskaps-podcasten Skeptoid, forklarer: “Hvordan og hvorfor kunne denne viktige vitenskapen avspore så til de grader, og ende opp som politikk? Dette skjedde fordi AGW aldri ble presentert for offentligheten som vitenskap; Den ble først presentert som en politisk sak. Kyoto-protokollen fra 1997, som skapte overskrifter da den trådte i kraft i 2005, var første gang de fleste hadde noen anelse om at global oppvarming var en sak. Kyoto var en FN-plan for å redusere industriutslipp, men bare i de rikeste landene, og ikke i det hele tatt i de største, fattigste utslipps-versting-landene. (Kina og India). Den var dypt mangelfull vitenskapelig og effektiv egentlig bare som et slag i ansiktet til USA. Industrielle krefter, mest i det politiske høyre, gikk i mot den; miljømessige krefter, i stor grad på venstrekanten, støttet den. (Avtalen ble enstemmig nedstemt av Senatet).
Den andre gangen allmennheten hørte om global oppvarming var også uvitenskapelig; Al Gores film An Inconvenient Truth fra 2006 var første gang at nesten alle hadde hørt om global oppvarming, og den ble oppfattet som enten sannhet eller løgn pga Al Gores svært polariserte posisjon i den politiske verden. Gore var en stor forkjemper for Kyoto-protokollen, og ble allerede oppfattet av konservative mer som en fiende av kapitalismen enn som en forsvarer av miljøet. Folk som så filmen på kino var predisponerte til å enten elske eller hate det han sa uansett om han fortalte sannheten eller ikke. Det faglige innholdet betydde lite. Og det er akkurat det som fikk oss der vi er. Den klart sterkeste indikator for en persons holdning til global oppvarming er hans eller hennes politiske tilhørighet. AGW er skrekkeksempelet på dårlig forskningsformidling. Men er det perfekte eksempel på at folk omfavner dårlig vitenskap fordi en er enig eller uenig i en ideologi, enten politisk eller filosofisk eller økologisk."
Veldig mange vil derfor basere sitt syn på menneskeskapt global oppvarming mye mer pga base og politisk ståsted, enn vitenskapen i seg selv. (Og for ordens skyld; Al Gore er altså ingen klimaforsker og Fns Klimapanel driver heller ikke med klimaforskning. Klimapanelets mandat er å sammenfatte forskningen, ikke utføre den. Vi har visst om at mennesker bidrar til global oppvarming lenge før og helt uavhengig av disse. Misnøye mot dem pga politisk ståsted eller lignende forandrer ikke noenting om de harde fakta. Gå gjerne rett til kildene, til klimaforskerne.)
"Vi lærer ikke ting hovedsaklig gjennom individuell kognitiv innsats - ved å samle beviser og evaluere dem. Individuelt er vi i stand til å kritisk vurdere bare en brøkdel av hva vi hevder å vite. Hovedtyngden av vår kunnskap, hviler på tro. Eller for å si det mer nobelt; på tillit. Vi absorberer kunnskap fra klarerte kolleger og myndigheter. Vår tillit til dem er en slags heuristikk som tillater oss å navigere i en vill kompleks og usikker virkelighet, som vi direkte bare vil oppleve en liten brøkdel av. Å ha en forståelse av verden og din plass i den - en forståelse som deles av "stammen" - føles som sikkerhet. Det føles som kontroll. Spørsmål som rokker denne forståelsen vil instinktivt behandles med skepsis eller direkte fiendtlighet. For de fleste mennesker, mesteparten av tiden, vil sosiale bånd uansett bety langt mer enn noen spesiell bit av kunnskap, noe faktum eller mening. Dette gjelder spesielt når det kommer til den slags ting som er definert som politiske "saker", som ulikheter, klimaendringer og andre samfunnsmessige risikoer, som har en tendens til å bli noe abstrakt og fjernt fra daglig erfaring. De fleste av oss har ofte ikke avgjorte, sammenhengende meninger om slike saker i det hele tatt, bare ting og tang vi har plukket opp fra våre "stammer". Vi har absolutt ikke investert nok i slike saker til å rettferdiggjøre risikoen å miste våre stammebånd på vegne av bestemte oppfatninger.”. Hvorfor smarte mennesker ikke tror på klimaendringer.
"Vi lærer ikke ting hovedsaklig gjennom individuell kognitiv innsats - ved å samle beviser og evaluere dem. Individuelt er vi i stand til å kritisk vurdere bare en brøkdel av hva vi hevder å vite. Hovedtyngden av vår kunnskap, hviler på tro. Eller for å si det mer nobelt; på tillit. Vi absorberer kunnskap fra klarerte kolleger og myndigheter. Vår tillit til dem er en slags heuristikk som tillater oss å navigere i en vill kompleks og usikker virkelighet, som vi direkte bare vil oppleve en liten brøkdel av. Å ha en forståelse av verden og din plass i den - en forståelse som deles av "stammen" - føles som sikkerhet. Det føles som kontroll. Spørsmål som rokker denne forståelsen vil instinktivt behandles med skepsis eller direkte fiendtlighet. For de fleste mennesker, mesteparten av tiden, vil sosiale bånd uansett bety langt mer enn noen spesiell bit av kunnskap, noe faktum eller mening. Dette gjelder spesielt når det kommer til den slags ting som er definert som politiske "saker", som ulikheter, klimaendringer og andre samfunnsmessige risikoer, som har en tendens til å bli noe abstrakt og fjernt fra daglig erfaring. De fleste av oss har ofte ikke avgjorte, sammenhengende meninger om slike saker i det hele tatt, bare ting og tang vi har plukket opp fra våre "stammer". Vi har absolutt ikke investert nok i slike saker til å rettferdiggjøre risikoen å miste våre stammebånd på vegne av bestemte oppfatninger.”. Hvorfor smarte mennesker ikke tror på klimaendringer.
The idea is that when people are faced with a myth and a competing fact, the fact will more easily win out if the fallacy underpinning the myth is revealed. In fact, these concepts of misconception-based learning and inoculation against myths were the basis of the free online Denial101x course developed by Cook and colleagues.
Disse to studiene kan forklare mye av denne "hvorfor folk ikke "tror" på forskningsresultater" greien:
This result suggests that public divisions over climate change stem not from the public’s incomprehension of science but from a distinctive conflict of interest: between the personal interest individuals have in forming beliefs in line with those held by others with whom they share close ties and the collective one they all share in making use of the best available science to promote common welfare.
A paper earlier this year from Vanderbilt University pinpointed what motivates many who choose to reject climate change: not science denial, but “regulation phobia”. Most deniers accept science in general, and even pride themselves on their science literacy, however, combatting climate change means more regulations and, the paper says, “demands a transformation of internalised attitudes”. This, the authors conclude, “has produced what can fairly be described as a phobic reaction among many people”.
Fortrengning» er en psykologisk forsvarsmekanisme som brukes for å bli kvitt følelser, opplevelser eller kunnskap vi opplever som ubehagelige, eller som har som naturlig konsekvens at vi må gjøre utrivelige ting, som for eksempel å betale mer for bensin eller å skru av gulvvarmen på badet vårt.
Kognitiv motivasjon. ...”folk starter med en forutinntatt overbevisning, og så anvender de all sin kognisjon, altså tenkning, og bruker det til å støtte opp under forestillingen»[..]«Det er på mange måter det motsatte av hva en forsker gjør. En forsker vil ha en hypotese, ja, men så går vi ut og tester den og ser om det finnes bevis som kan støtte opp under hypotesen. Dersom det ikke finnes bevis, så blir hypotesen før eller senere lagt på hylla. Idet du sysler med kognitiv motivasjon, derimot, vil du gjøre alt du kan for å holde fast ved din opprinnelige forestilling.»
Og: Mennesker viser sterke tendenser til å unngå en økning av eksisterende dissonans. Vi utsetter oss selv for kilder til informasjon som forventes å tillegge nye elementer som kan øke vår konsistens, men unngår kilder som kan øke vår dissonans.

Og hva skjer når budbringeren du stoler på farer med juks, fanteri og løgner? Vi skal se på de harde fakta om klima straks. Ta bort politikk, ideologi, stammetenking og religion. Først må vi se på hva som er det beste verktøyet vi har for å tilegne oss kunnskap om verden.

5. DEN VITENSKAPELIGE METODE
Et av de viktigste elementene ved den vitenskapelige metode, er rapporteringsprosedyrene. Det vanlige er at nye oppdagelser blir skrevet etter en protokoll, som andre kan bruke til å gjenskape observasjonen. Alle relevante forhold som hypotesene man testet, metoden man brukte, hvilke funn mann gjorde og hvilke konklusjoner man trekker fra dette, beskrives nøyaktig. Dette blir så ofte vurdert av såkalte fagfeller, andre eksperter på samme område. Slike rapporter publiseres i vitenskapelige tidsskifter, og rapporten blir som regel tilgjengelig for andre fagfolk. Dermed kan hvem som helst etterprøve observasjonen, og eventuelt komme med innsigelser eller korreksjoner av funnene. Selv om ett enkelt funn fra ett enkelt eksperiment ikke alltid er banebrytende i seg selv kan det være et vesentlig ledd i å finne svar på store vitenskapelige gåter. På denne måten bygges dokumentert og etterprøvbar kunnskap, steg for steg. Metoden produserer ikke, og er heller ikke ment for å produsere, absolutte sannheter og viten, men økt kunnskap. Slik er det – og slik må det også være – i klimaforskningen som for all annen forskning. Store teorier er stort sett alltid bygget på en stor mengde mindre vitenskapelige funn. Og det er nettopp det at alle disse småfunnene er gjort gjennom utførelse av den vitenskapelige metode som gjør de store vitenskapelige teoriene så robuste og troverdige. Det er med andre ord uendelig mange filtere, tester, korrigeringer og innsigelser frem til en får en konklusjon. At mennesker bidrar til klimaendringer er en slik konklusjon. Forskningen gir oss helt tydelige og klare dataer fra en rekke vitenskapelige felter som hver for seg -og sammen, kommer til den samme konklusjonen: mennesker bidrar til klimaendringer. Dette er ikke prognoser, antydninger eller modeller. Dette er OBSERVERTE dataer fra pollen, årringer, iskjerner, koraller, isbreer, polaris som smelter, havnivået, havtemperatur, økologiske forandringer, Co2-nivået i atmosfæren, den udiskutable temperaturøkningen globalt.
Based upon the principles of basic physics and billions of data points filtered through the scientific method for 150 years, yes, its settled that humans are the main driver for the GW we have seen since 1850. This is as settled as evolution. The greenhouse effect is school science.
Although a simple finding from a single experiment is not always pioneering in itself, it can be an essential part of finding answers to major scientific puzzles. In this way, documented and verifiable knowledge is built, step by step.
The scientific method does not produce, nor is meant to produce, absolute truths and knowledge, but increased knowledge. Such is the case - and so it must be - in climate research as for all other research. Major theories are generally always based on a large amount of smaller scientific findings. Becuase these little discoveries are made through the implementation of the scientific method, they makes the major scientific theories so robust and credible. In other words, there are infinite many filters, tests, corrections and objections until one gets a conclusion.
That humans contribute most to climate change with our C02 emissions is such a conclusion.
The research gives us unequivocal and quite clear data from a number of scientific fields that individually - and together - come to the same conclusion: people contribute to climate change. These are not forecasts, hints or models.
These are OBSERVED data from pollen, tree rings, ice cores, corals, glaciers withdrawal, polar ice melting, sea level rise, ocean temperature, ecological changes, Co2 levels in the atmosphere, the undeniable temperature increase globally.
Scientists are working on the details and are improving the knowledge database every day. New finding and corrections are happening on a daily basic. This is science at work, it doesnt mean the main theory is wrong.Skeptiker og vitenskaps-historikeren Michael Shermer tar opp tråden:“AGW doubters point to the occasional anomaly in a particular data set, as if one incongruity gainsays all the other lines of evidence. But that is not how consilience science works. For AGW skeptics to overturn the consensus, they would need to find flaws with all the lines of supportive evidence and show a consistent convergence of evidence toward a different theory that explains the data. (Creationists have the same problem overturning evolutionary theory.) This they have not done.” Les hele hans kronikk her.
“Klimaendringer handler ikke om å tro, det handler om å forstå de prosessene som styrer klimaet, både naturlige og menneskeskapte faktorer.Vitenskap er kunnskap som er basert på forståelse av naturens fysiske lover og fremskaffet ved hjelp av undersøkelser og testing av hypoteser. All kunnskap skal være etterprøvbar, derfor står publisering sentralt innen forskningen. Et krav i klimadebatten bør således være at den skjer på bakgrunn av publisert materiale i vitenskapelige anerkjente tidsskrifter."
“Klimaendringer handler ikke om å tro, det handler om å forstå de prosessene som styrer klimaet, både naturlige og menneskeskapte faktorer.Vitenskap er kunnskap som er basert på forståelse av naturens fysiske lover og fremskaffet ved hjelp av undersøkelser og testing av hypoteser. All kunnskap skal være etterprøvbar, derfor står publisering sentralt innen forskningen. Et krav i klimadebatten bør således være at den skjer på bakgrunn av publisert materiale i vitenskapelige anerkjente tidsskrifter."
Kritisk tenkning er et nøkkelord her. Har den artikkelen du leser om klima vært igjennom kvalitetskontrollen her beskrevet? Astrofysikkeren Neil deGrasse presiserer at fakta er fakta enten en velger å tro på dem eller ikke. Vitenskapen kan ikke ta hensyn til våre følelser, religion, ideologi eller politikk:
Ingrid Bay-Larsen, forskningsleder ved Nordlandsforskning, skriver disse kloke ordene og forteller samtidig om hvordan Fns Klimapanel jobber:
"[...]det som er unikt med vitenskapelige tradisjoner, er at de har gjort det mulig å beskrive og forstå en del sammenhenger som vi ellers ikke ville sett, med høy grad av sikkerhet. Det er disse sammenhengene som nå bestrides, både av vaksinemotstandere og klimaskeptikere.
Når FNs klimapanel, IPCC, gir ut sine rapporter baserer de seg på en gjennomgang av alle relevante vitenskapelige arbeider som er publisert i fagfellevurderte tidsskrifter. Det er snakk om mange tusen artikler. For dem som måtte være interessert i å finne bevisgrunnlaget for at klimaendringene er menneskeskapte, er det altså nok å lese på. Disse sammenfattes i omfattende rapporter som så sendes på det som ligner en offentlig høring. Om lag 3000 eksperter og 100 lands myndigheter deltok i arbeidet. I tillegg kan alle som ønsker det registrere seg og gi innspill.
Dette er med andre ord ikke et ekkokammer. Tvert imot er det lagt stor vekt på åpenhet og involvering av ulike stemmer, på tvers av geografi, samfunnssektorer og over tid. Under utarbeidelsen av den femte rapporten kom det inn 142 631 kommentarer. Avsenderne er alt fra forskere via interesserte legfolk til klimaskeptikere. IPCC har forpliktet seg til å vurdere, og gi svar på alle innspill. Både kommentarer og svar blir liggende åpent tilgjengelig i etterkant på IPCCs nettside (climatechange2013.org).
Når klimaskeptikere i Norge og andre land henviser til at enkeltstudier viser at klimaendringene ikke er menneskeskapte, så er dette altså arbeider som allerede er tatt opp og vurdert opp mot resten av litteraturen. Og deretter tilbakevist av andre studier. De rokker altså ikke ved det store bildet. Tvert imot har gjentagende kritikk gjort at kunnskapen er testet fra utallige vinkler, med det resultat at hovedkonklusjonene er blitt mer robuste.
Klimakunnskapen er blitt bedre.
[...] Hvis klimaskeptikerne allikevel ønsker å lage studier som har til formål å motbevise det man har slått fast, har de på lik linje med alle andre forskere muligheten for å konkurrere om forskningsoppdrag og publisere funnene sine i vitenskapelige publikasjoner."
Science has its own method of interrogating itself to discern validity: a two-stage process involving peer-review and replication. In order to be published in scientific journals, research must first be scrutinized by other experts in the field. Once results are published in a peer-reviewed journal, other scientists attempt to replicate them in subsequent research. If the results can’t be replicated, they fall out of favor. On the other hand, our confidence in a scientific result grows stronger each time it is replicated by an independent study.
6. DE BESTE BEVISENE FOR GLOBAL OPPVARMING OG AT DET ER MENNESKERS UTSLIPP AV CO2 SOM ER HOVEDÅRSAKEN
HVORDAN VI VET 100% AT DET ER MENNESKERS FORBRUK AV CO2 SOM ER ÅRSAKEN TIL GLOBAL OPPVARMING - KUN VED HJELP AV SKOLE-VITENSKAP; ELEMENTÆR KJEMI OG GRUNNLEGGENDE FYSIKK
(Det er og en egen større bloggpost om dette her.)
La oss forklare hvor enkelt vi finner frem til at menneskeskapt CO2 bidrar til drivhuseffekten og at det nettopp er C02 som er den klimagassen som bidrar mest; Det handler ikke om modeller, spådommer, gjetting eller estimeringer, men om enkle, direkte observasjoner og grunnleggende kjemi og fysikk. Dette er data som, hvem som helst, når som helst, kan observere og reprodusere, attpåtil med vitenskap som har vært tilgjengelig i henholdsvis 80 og 200 år!
Abstract:
Karbonet i det CO2et som er i atmosfæren (13) inneholder informasjon om hvor det kommer fra, slik at forskere kan regne ut at fossilt brensel-utslipp er den største kilden til varmeøkningen siden preindustriell tid. Vi kan sjekke mengden radioaktive karbonatomer i atmosfæren. Denne endrer seg, akkurat som vi forventer hvis det er fossilt karbon - som har en annen mengde radioaktivitet - som har kommet opp i atmosfæren. Det karbonet som kommer fra fossilt brent C02 har altså isotop-signaler (radioaktivitet) som ingen av de andre naturlige kildene til C02 har! Det er som et fingeravtrykk. Det er karbonets "DNA". Det er unikt.
De samme elementene (dvs. samme antall protoner i kjernen) med forskjellige massetall (som kommer fra forskjellige antall nøytroner i kjernen) kalles isotoper. Hvert karbonmolekyl har seks protoner i kjernen, men det er mange forskjellige isotoper med varierende antall nøytroner i kjernen.
Karbonisotoper fra forskjellige kilder er "lettere" (høy negativ verdi) eller tyngre (lavere negativ verdi). For eksempel er karbon fra havet standarden, med en verdi på "0", mens karbon fra fossile brensler varierer fra -20 til -32. Mens atmosfærisk karbon har en gjennomsnittsverdi på -5 til -9, blir den "lettere" over tid da karbon fra fossile brensel blir mer rikelig i atmosfæren.
Det er menneskelige fingeravtrykk på overbelastningen av karbon. Når mennesker brenner kull, olje og gass (fossilt brensel) for å generere elektrisitet eller kjøre bil, slippes karbondioksid ut i atmosfæren, hvor den fanger opp varme. Et karbonmolekyl som kommer fra fossile brensler og avskogning er "lettere" enn det kombinerte signalet fra andre kilder. Ettersom forskere måler «vekten» av karbon i atmosfæren over tid ser de en klar økning i de lettere molekylene fra fossilt brensel og avskogingskilder som korresponderer nøyaktig med den kjente utviklingen i utslipp.
Orginalen er hentet fra Skeptoid.
Orginalen er hentet fra Skeptoid.
Her kommer et sammendrag i min oversettelse:
Levende ting, som dyr og trær, er i likevekt med atmosfæren. Når de spiser og puster og samhandler, inneholder de samme proporsjoner av karbonisotoper som atmosfæren. Når de dør, vil karbon-14 avta over en lengre periode, og da organismen ikke lenger spiser og puster, vil ikke ny karbon-14 komme inn i atmosfæren, og til slutt vil karbon-12 (og noe karbon-13) være de eneste. Fossile brensler som olje og naturgass kommer fra planter som døde for millioner av år siden, og har ingen karbon-14 igjen. Den CO2 som produseres ved forbrenning av fossile brensler inneholder kun karbon-12.
Når en skogbrann herjer, vil CO2 i røyken komme fra levende eller nylig døde brensler, slik at røyken inneholder de samme mengder karbon-12 og karbon-14 som atmosfæren. Dette er tilfellet med nesten alle naturlige kilder til CO2(2). Vi kan karbondatere CO2 i atmosfæren, og fortelle nøyaktig hvor mye av det som kommer fra menneskers forbruk av fossile brensler. Det er en sikker måling. Det etterlates ikke rom for tolkning.
Når en skogbrann herjer, vil CO2 i røyken komme fra levende eller nylig døde brensler, slik at røyken inneholder de samme mengder karbon-12 og karbon-14 som atmosfæren. Dette er tilfellet med nesten alle naturlige kilder til CO2(2). Vi kan karbondatere CO2 i atmosfæren, og fortelle nøyaktig hvor mye av det som kommer fra menneskers forbruk av fossile brensler. Det er en sikker måling. Det etterlates ikke rom for tolkning.
Det er èn naturlig kilde av CO2 som bare inneholder karbon-12, og som ofte påpekes av klimaskeptikere som den virkelige kilden til denne nye karbon-12: vulkaner. Vulkaner over hele verden har stadige utbrudd både på land og under havet. De gjør det i et ganske konstant tempo. Vi måler deres CO2- produksjon, og vi vet at årlig på verdensbasis bidrar vulkansk aktivitet gjennomsnittlig om lag 200 millioner tonn CO2 til atmosfæren, alle med karbon-12, som er umulig å skille fra karbon-12 produsert ved forbrenning av fossilt brensel. Men hvert år, måles det totalt ca 29 (tallet er beregnet til nærmere 40 pr 2018) milliarder tonn CO2 til atmosfæren. Det er mer enn 100 ganger den mengden vulkaner står for. Den eneste mulige kilden til dette resterende nye CO2et, er fossilt brensel brent av mennesker.

Dette, er kort sagt, det avslørende beviset for at økningen i CO2 i atmosfæren er forårsaket av menneskers forbruk av fossilt brensel. Det er ikke en formodning eller en modell eller et anslag, det er en måling alle kan reprodusere, og isotoper er isotoper, og har ikke alternative forklaringer.
Dette, er kort sagt, det avslørende beviset for at økningen i CO2 i atmosfæren er forårsaket av menneskers forbruk av fossilt brensel. Det er ikke en formodning eller en modell eller et anslag, det er en måling alle kan reprodusere, og isotoper er isotoper, og har ikke alternative forklaringer.
Some have said that 29 (its 40 billion tons now) is not a problem, because of how small that is compared to the atmosphere's total existing carbon load. It's true that 40 billion tons is a drop in the bucket compared to the 750 billion tons that moves through the carbon cycle each year, which is our name for the natural processes by which carbon is exchanged between the atmosphere and the oceans and vegetation.
All of this extra carbon needs to go somewhere. So far, land plants and the ocean have taken up about 55 percent of the extra carbon people have put into the atmosphere while about 45 percent has stayed in the atmosphere.
Eventually, the land and oceans will take up most of the extra carbon dioxide, but as much as 20 percent may remain in the atmosphere for many thousands of years.
The Carbon Cycle
The Carbon Cycle
Vi trenger heller ikke modeller eller spådommer for å måle varmekilden direkte i atmosfæren. Det er 5 klimagasser som er ansvarlig for drivhuseffekten. Disse er metan, vanndamp, lystgass, ozon og C02. Dette vet vi pga spektroskopi.

Spektroskopi er vanntett vitenskap. Bare ved å peke våre instrumenter på himmelen, kan vi , akkurat nå, direkte observere og identifisere klimagasser, og måle nøyaktig hvor mye strålingsenergi atmosfæren absorberer og hvor mye som holder seg her på jorden. Denne direkte, ikke-tvetydig spektroskopiske avlesing er det avslørende beviset for at energien fra overskuddsvarme som blir fanget i atmosfæren skyldes CO2. Dette overflødige CO2et er produsert av mennesker som brenner fossile brensler. Vi har også målt jordas infrarøde spekter fra verdensrommet, fra satellitter, for å se hvilke bølgelengder av varmeenergi som blir fanget av gasser i atmosfæren, og hvilke som unnslipper. For å se deltaet isolerer vi de nye målingene fra de gamle, for å se nøyaktig hvor i spekteret noen endring har skjedd. Grafen forklart.

Innenfor det infrarøde vinduet som er definert av vanndamp, er det et stort utslag; 15 um spekteret for CO2. (9) Dette er eksplisitt og entydig bevis på at den økte varmen i atmosfæren skyldes CO2. Det er en direkte observasjon, det er kjemi og grunnleggende fysikk, ikke gjetting eller estimering.
Global average surface temperature is perhaps the single most representative measure of a planet’s climate since it reflects how much heat is at the planet’s surface. Local temperature changes can differ markedly from the global average. One reason for this is that heat moves around with the winds and ocean currents, warming one region while cooling another, but these regional effects might not cause a significant change in the global average temperature. A second reason is that local feedbacks, such as changes in snow or vegetation cover that affect how a region reflects or absorbs sunlight, can cause large local temperature changes that are not mirrored in the global average. We therefore cannot rely on any single location as being representative of global temperature change.
På denne siden til NASA finner en alt, forklart på en ryddig og oversiktlig måte.
På denne siden til NASA finner en alt, forklart på en ryddig og oversiktlig måte.


"A large body of evidence supports the conclusion that human activity is the primary driver of recent warming. This evidence has accumulated over several decades, and from hundreds of studies. The first line of evidence is our basic physical understanding of how greenhouse gases trap heat, how the climate system responds to increases in greenhouse gases, and how other human and natural factors influence climate. The second line of evidence is from indirect estimates of climate changes over the last 1,000 to 2,000 years"
Denne Vox-artikkelen forklarer godt. I november 2017 :En av de grundigste klimarapportene i nyere tid bekrefter at så godt som all global oppvarming etter 1950 er menneskeskapt.
The 600 page report was created from input by scientists working at 13 different federal government agencies. “Based on extensive evidence … it is extremely likely that human activities, especially emissions of greenhouse gases, are the dominant cause of the observed warming since the mid-20th century,”
Hele denne store rapporten var peer reviewed av the National Academy of Sciences, som i sin tid ble grunnlagt av Abraham Lincoln. NAS har 200 Nobelpris-vinnere blant sine medlemmer.
Fourth National Climate Assessment (NCA4), Volume I
This report is an authoritative assessment of the science of climate change, with a focus on the United States. It represents the first of two volumes of the Fourth National Climate Assessment, mandated by the Global Change Research Act of 1990.

Ny rekord: 2016 ble det varmeste året noensinne målt på jorda sier Europas Copernicus. NOAA bekrefter alle varmerekordene i nyere tid.Denne rapporten og denne rapporten fra Nature bekrefter oppvarmingen:

January 2018 was the fifth warmest January in 138 years of modern record-keeping, according to scientists at Goddard Institute for Space Studies.
March 2018 was one of six warmest Marches on record.
The modern global temperature record begins around 1880 because previous observations didn't cover enough of the planet. The current monthly analysis is assembled by NASA scientists who analyze temperature data from about 6,300 meteorological stations, ship- and buoy-based sea surface temperature measurements, and Antarctic research stations.
Hva sier World Meterological Organization?
"The year 2016 made history, with a record global temperature, exceptionally low sea ice, and unabated sea level rise and ocean heat, according to the World Meteorological Organization (WMO). Extreme weather and climate conditions have continued into 2017."
Worrisome first quarter of 2017 climate trends:
The year is off to a toasty start globally ... and not in a comforting way for those concerned about another year of high temperatures, sea ice record lows at both Poles, and mounting risks to coral reefs.
Mauna Loa Observatory på Hawaii bekrefter tallene. Scientific American bekrefter her. Popular Science har en glimrende oppdatert sak her. Den Pulitzer-pris-vinnende faktasjekkeren PolitiFact bekrefter også at c02-nivået nå er over 400 parts pr million.
Videre: Her er en liste med ti enkle «facts of life» fra klimaforskningen, og hvordan vi vet det vi vet.
Her er og en god oversikt. Mer om det rekordhøye C02 nivået her.
In the case of man-made global warming, the theories seem to fit the facts, which is as close as you can get. Over 150 years ago. Scientists discovered experimentally that certain gases, such as carbon-dioxide, methane, and nitrous oxide absorbed more of the Sun’s infrared light than oxygen or nitrogen, the main naturally occurring gases in the atmosphere. At that time, they predicted that if humans ever started producing and releasing large amounts of these, the atmosphere would heat up. Then, humans did start producing and releasing these gases. Then, the Earth did start heating up, and in an amount that closely fit the predicted amount. Making a prediction and then having that prediction come true is considered one of the best tests that a theory is true in science, so by that measure the theory is considered proven.
https://royalsociety.org/topics-policy/projects/climate-change-evidence-causes/?fbclid=IwAR16_64MDYoxNtlidslOTbk_q4IDqg6R6zCfUVN0jQq9f3NYDEgU979IfEU
http://nas-sites.org/americasclimatechoices/events/a-discussion-on-climate-change-evidence-and-causes/?fbclid=IwAR16Wrvod_JhA9n1tkgM2KyqkXjiZ1ohwKuzTI_XDX23J6hAQmYIBp_Y6cc
https://history.aip.org/climate/pdf.htm?fbclid=IwAR0UtD5FpZPXY-tD09i7YXQ0zIEllj0jAMEMDiq8sv0mXfE_VXU0aT3RoE8
BONUS:


Linker til den beste vitenskapen:
http://nas-sites.org/americasclimatechoices/events/a-discussion-on-climate-change-evidence-and-causes/?fbclid=IwAR16Wrvod_JhA9n1tkgM2KyqkXjiZ1ohwKuzTI_XDX23J6hAQmYIBp_Y6cc
https://history.aip.org/climate/pdf.htm?fbclid=IwAR0UtD5FpZPXY-tD09i7YXQ0zIEllj0jAMEMDiq8sv0mXfE_VXU0aT3RoE8
BONUS:
BEKREFTER DATA FRA NORGE DEN GLOBALE TRENDEN?
Ville det ikke vært svært interessant hvis observasjoner her hjemme bekreftet den globale trenden? Meteorologisk Institutt har målt temperaturen i Norge siden år 1900.
https://www.dagbladet.no/nyheter/viser-endringene-markant-forskjell/79626266?push-id=130fb900-105f-11ee-8725-2a4972085ea4&token=7e2901ca4ffd0123d7aa5c1659acd51d821e44fea2bf1e70d6a7fc0513c872f9&fbclid=IwAR3iSlCTPznoRE0WW0ypiTb0ri74N7nV7Q3JrOmOLkhWNeVIfE0I8KHRxHw
Vi har altså bunnsolide data som er i samsvar med den globale oppvarmingen, Copernicus og dataene til NASA. Les mer om kvaliteten på observasjonene her.
Vi har altså bunnsolide data som er i samsvar med den globale oppvarmingen, Copernicus og dataene til NASA. Les mer om kvaliteten på observasjonene her.
“Det er normalt at temperaturen varierer fra år til år på grunn av naturlige variasjoner som havstrømmer, El Niño, vulkanutbrudd, endringer i solen og jordens bane rundt solen. Men dersom vi kun hadde naturlige variasjoner, så skulle temperaturen variert opp og ned, uten å stige over tid”
Ok, la oss og sjekke våre naboer. La oss gå videre til Danmark og deres Meterologiske Institutt: . Siden 1870'erne er temperaturen i Danmark steget med ca. 1,5°C. De syv år
2006, 2007, 2008, 2014, 2018, 2019 og 2020 er de varmeste år overhovedet
registreret i Danmark. MAO bekrefter dataene fra Danmark Copernicus sine data og er i samsvar med det som NASA har konkludert med globalt. Og at temperaturen har økt kraftig de siste 10-årene.
Hva sier svenskene mon tro?: Sveriges meteorologisk och hydrologiska institut SMHI har sikre målinger tilbake til 1860. Ökningen av Sveriges medeltemperatur närmar sig nu två grader jämfört med slutet av 1800-talet. Vi sitter altså på solide data som viser at Skandinavia har hatt en oppvarming de siste 150 år der særlig de siste 10-årene har vist kraftig økning. Data som er i samsvar med Copernicus og NASA sine data - og helt i tråd med hva værstasjoner over hele kloden forteller oss.

OPPSUMMERING i 2 videoer:
KONKLUSJON
Vi er i en interglacial periode akkurat nå. Det begynte på slutten av den siste istiden, ca 10.000 år siden. De siste ca 8000 år har vi langsomt beveget oss mot en ny istid. Og siden 70-tallet har energien og varmen fra solen vært avtagende. Nedre del av atmosfæren blir varmere mens den ytre blir kaldere. Et tydelig menneskelig avtrykk. Sammenlign den langsomme, naturlige kjølingen med den plutselige oppvarmingen som startet med den industrielle revolusjonen. Det er en grunn til at endringene vi ser nå er 10-20 ganger så brå, og i motsatt retning av den naturlige trenden. Naturlige sykluser kan bare flytte varmen rundt, som fra havene til atmosfæren. Men nå ser vi varme tilført både i havene og atmosfæren. Denne tilførselen av varme til energibudsjettet vi ser nå, må komme fra et annet sted enn naturlige sykluser.
Dette er det skumle:
Jorden skulle altså blitt kaldere nå. Men i stedet ser vi kraftig oppvarming. Vi ser økning av havnivå, og havene blir varmere, overflatetemperaturene blir høyere, Grønnlandsisen smelter, den arktiske sjøisen smelter, selv i Antarktis er det nå mer tap av is enn vekst. Store hetebølger raser i Europa sommeren 2017 osv. Det kan bare være en forklaring. Menneskers innflytelse er nå den dominerende faktoren for klimaendringer.
We are in an interglacial period right now. It began at the end of the last Ice Age, about 10,000 years ago. For about 8000 years we have moved slowly towards the next ice age (now postponed because of our C02 emissions).
Civilizations has existed and thrived during a period when the temperature varied by only 2°C or so. What will happen when the temperature leaves the realm in which it has existed for its brief life of 12,000 years? Nobody really knows.
The effects of today's global warming are felt by societies and existing ecosystems adapted to the Holocene climate in OUR TIME - NOT the climate and CO2 levels that existed hundreds of millions of years ago.
The planet needs stability. The ecosystems cant adapt to rapid changes. Compare it to your own body temperature. Just a small drop or raise in body temperature will cause us problems, pain - or worse.
Compare the slow, natural cooling with the sudden warming that started with the industrial revolution. Do you think there is a reason why the changes we see now are up to 20 times as rapid and in the opposite direction of the slow natural cooling trend?
If the warming were caused by a more active sun, then scientists would expect to see warmer temperatures in all layers of the atmosphere. Instead, they have observed a cooling in the upper atmosphere, and a warming at the surface and in the lower parts of the atmosphere. That's because greenhouse gases are trapping heat in the lower atmosphere. A very clear human fingerprint.
Carbon dioxide levels in the atmosphere have increased far beyond any level seen naturally in the last 800,000 years. This increase has taken place since the start of the industrial revolution and is the result of burning fossil fuels. The increase is happening at a time when, naturally, carbon dioxide levels should be decreasing.
Look at the spike to the right. Thats because of us.

This is the scary part:
THE HUMAN INFLUENCE ON CLIMATE CHANGE IS SO STRONG WE ARE MAKING THE PLANET RAPIDLY WARM IN A TIME WHEN IT SHOULD BE SLOWLY COOLING!!
The earth should have become slowly cooler now. But instead, we see very rapid warming, in the OPPOSITE direction of the natural slow cooling trend. We see ocean level rise, and the sea is getting warmer, the surface temperatures are getting higher, the Greenland ice is melting, the Arctic sea ice melts, even in Antarctica there is a record low on ice. It can only be one explanation; Human influence is now the dominant factor for climate change.
"The climate during the warm interglacial periods, like now, is more stable than the climate of ice age climate."
Further proof that the rapid GW we see now is NOT natural.
Climate variations analyzed five million years back in time
WE have changed the natural pattern:

Dette er det skumle:
Jorden skulle altså blitt kaldere nå. Men i stedet ser vi kraftig oppvarming. Vi ser økning av havnivå, og havene blir varmere, overflatetemperaturene blir høyere, Grønnlandsisen smelter, den arktiske sjøisen smelter, selv i Antarktis er det nå mer tap av is enn vekst. Store hetebølger raser i Europa sommeren 2017 osv. Det kan bare være en forklaring. Menneskers innflytelse er nå den dominerende faktoren for klimaendringer.
We are in an interglacial period right now. It began at the end of the last Ice Age, about 10,000 years ago. For about 8000 years we have moved slowly towards the next ice age (now postponed because of our C02 emissions).
Civilizations has existed and thrived during a period when the temperature varied by only 2°C or so. What will happen when the temperature leaves the realm in which it has existed for its brief life of 12,000 years? Nobody really knows.
The effects of today's global warming are felt by societies and existing ecosystems adapted to the Holocene climate in OUR TIME - NOT the climate and CO2 levels that existed hundreds of millions of years ago.
The planet needs stability. The ecosystems cant adapt to rapid changes. Compare it to your own body temperature. Just a small drop or raise in body temperature will cause us problems, pain - or worse.
Compare the slow, natural cooling with the sudden warming that started with the industrial revolution. Do you think there is a reason why the changes we see now are up to 20 times as rapid and in the opposite direction of the slow natural cooling trend?
If the warming were caused by a more active sun, then scientists would expect to see warmer temperatures in all layers of the atmosphere. Instead, they have observed a cooling in the upper atmosphere, and a warming at the surface and in the lower parts of the atmosphere. That's because greenhouse gases are trapping heat in the lower atmosphere. A very clear human fingerprint.
Carbon dioxide levels in the atmosphere have increased far beyond any level seen naturally in the last 800,000 years. This increase has taken place since the start of the industrial revolution and is the result of burning fossil fuels. The increase is happening at a time when, naturally, carbon dioxide levels should be decreasing.
Look at the spike to the right. Thats because of us.
This is the scary part:
THE HUMAN INFLUENCE ON CLIMATE CHANGE IS SO STRONG WE ARE MAKING THE PLANET RAPIDLY WARM IN A TIME WHEN IT SHOULD BE SLOWLY COOLING!!
The earth should have become slowly cooler now. But instead, we see very rapid warming, in the OPPOSITE direction of the natural slow cooling trend. We see ocean level rise, and the sea is getting warmer, the surface temperatures are getting higher, the Greenland ice is melting, the Arctic sea ice melts, even in Antarctica there is a record low on ice. It can only be one explanation; Human influence is now the dominant factor for climate change.
"The climate during the warm interglacial periods, like now, is more stable than the climate of ice age climate."
Further proof that the rapid GW we see now is NOT natural.
Climate variations analyzed five million years back in time
WE have changed the natural pattern:


7. LA OSS GÅ LITT I DYBDEN PÅ NOEN AV KLIMAMYTENE:
MYTE #1 DET ER SOLEN, STUPID
Joseph Fourier fant ut allerede på 1820-tallet at strålingsvarme fra solen alene IKKE er nok til å gi vår klode en middeltemperatur på + 15 c. Men er det solen som er skyld i de siste 40 årenes kraftige oppvarming?
If the sun is such a key driver of the Earth’s climate, then why has the entire planet (air, oceans, land, and ice) warmed rapidly over the past 60 years while solar activity has declined?
La oss først høre direkte med dem som jobber med det. Ekspertene:
If the sun is such a key driver of the Earth’s climate, then why has the entire planet (air, oceans, land, and ice) warmed rapidly over the past 60 years while solar activity has declined?
La oss først høre direkte med dem som jobber med det. Ekspertene:
"According to PMOD at the World Radiation Center there has been no increase in solar irradiance since at least 1978, when satellite observations began. This means that for the last thirty years, while the temperature has been rising fastest, the sun has not changed.
Verdens ledende vitenskapelige magazin - Science - hva sier de?;
"Don't blame the sun for recent global warming. A new analysis, based on historical data rather than computer simulations, shows that our star's role in climate change has been vastly overtaken by other factors, particularly the human-induced buildup of greenhouse gases."
CarbonBrief setter skapet på plass her.
"since 1970 global temperatures have shot up by almost 0.7 C, while the amount of solar energy reaching the Earth has actually declined. Similarly, the upper atmosphere is cooling while the lower atmosphere warms, a clear fingerprint of warming from greenhouse gases rather than the sun."
New Scientist bekrefter solens rolle her."So for the period for which we have direct, reliable records, the Earth has warmed dramatically even though there has been no corresponding rise in any kind of solar activity."
RealClimate oppklarer her. “The Sun provides the primary source of energy driving Earth’s climate system, but its variations have played very little role in the climate changes observed in recent decades. Global temperature goes from heat record to heat record, yet the sun is at its dimmest for half a century.
The Royal Society akademiet forklarer solens rolle her:
"Direct satellite measurements since the late 1970s show no net increase in the Sun’s output, while at the same time global surface temperatures have increased"
Our analysis shows that the most likely contribution from solar forcing a global warming is 7 ± 1% for the 20th century and is negligible for warming since 1980. R. E. Benestad, G. A. Schmidt 2009
Solar variability and climate change: is there a link?
After 1980, however, the Earth's temperature exhibits a remarkably steep rise, while the Sun's irradiance displays at the most a weak secular trend. Hence the Sun cannot be the dominant source of this latest temperature increase, with man-made greenhouse gases being the likely dominant alternative.
En ny studie fra University of Reading bekrefter at solen har vist en nedadgående trend siden 50-tallet og – innen midten av århundret vil vi kunne se den laveste solaktiviteten på 300 år, og denne situasjonen vil kunne vedvare i 50–60 år, hevder Dr. Mathew Owens, som har ledet studien.
Studien Evidence of recent causal decoupling between solar radiation and global temperature bekrefter at solen ikke har hatt betydning for den oppvarmingen vi har sett de siste 10-årene.
Bjørn Hallvard Samset ved CICERO peker på at det gjennom jordas historie har vært naturlige fenomen som har styrt endringer i klima: Sola, jordens bane rundt sola, kontinentaldrift, vulkaner, havstrømninger...Nå har det imidlertid kommet en ny påvirkning: Den sterke endringen i drivhuseffekten fra fossilt CO₂ (og en liten rekke andre av våre effekter). Denne påvirkningen er så sterk at den totalt drukner ut de andre – akkurat nå, sier Samset.
A study carried out on computer models at the Met Office Hadley Centre in Exeter calculated that a forthcoming grand solar minimum would cause global average temperatures to fall by about 0.1C. This study shows that the Sun isn’t going to save use from global warming, but it could have impacts at a regional level that should be factored in to decisions about adapting to climate change for the decades to come,”
A study carried out on computer models at the Met Office Hadley Centre in Exeter calculated that a forthcoming grand solar minimum would cause global average temperatures to fall by about 0.1C. This study shows that the Sun isn’t going to save use from global warming, but it could have impacts at a regional level that should be factored in to decisions about adapting to climate change for the decades to come,”
Konklusjon: Solen kan ikke forklare den kraftige oppvarmingen vi har sett de siste 40 år da varmen fra solen har vært nedadgående i denne perioden. Nedre del av atmosfæren blir varmere mens den ytre blir kaldere. Et tydelig menneskelig avtrykk.
 Annual global temperature change (thin light red) with 11 year moving average of temperature (thick dark red). Temperature from NASA GISS. Annual Total Solar Irradiance (thin light blue) with 11 year moving average of TSI (thick dark blue). TSI from 1880 to 1978 from Krivova et al 2007 (data). TSI from 1979 to 2009 from PMOD.

BONUS
Nei, det er ikke kosmisk stråling heller:
An analysis of more than 50 years' worth of climate data has found scant evidence for a controversial theory that attempts to link cosmic rays and global warming. The theory suggests that solar variations can affect the number of cosmic rays reaching the Earth, which in turn influences climate by impacting on cloud formation. The latest study was done by Rasmus Benestad of the Norwegian Meteorological Institute and he concludes that changes to the Sun cannot explain global warming.
http://www.realclimate.org/index.php/archives/2007/03/cosmoclimatology-tired-old-arguments-in-new-clothes/
Det er ingen korrelasjon mellom kosmisk stråling og temperatur eller nedbør.
Hypotesen om denne effekten på klimaendringene møter store problemer fordi
(a) det ikke har vært noen langsiktig endring i verken kosmisk stråling eller solaktivitet som kan forklare den observerte globale oppvarmingen;
(b) mekanismen bak hypotesen tilsier at måten sollys reflekteres på (jordens dagside) påvirker temperaturene, men den observerte oppvarmingen har vært størst om natten (der solen ikke skinner);
(c) det er ingen korrelasjon mellom kosmisk stråling og global temperature eller nedbør;
(d) det er ingen motsetning mellom en økt drivhuseffekt pga mer CO2 og hypotesen om kosmisk stråling ('false dichotomy'), men Svensmark antyder nettopp dette. Han har ikke klart å overbevise fagmiljøet nettopp fordi hans hypotese ikke har vært overbevisende, og da er resultatene fra hans eksperiment kun en liten detalje og bare en av mange andre brikker som må falle på plas. Mer: http://www.springer.com/us/book/9783540306207
___________________________________________________________
(a) there has been no long-term change in neither cosmic radiation nor solar activity that can explain the observed global warming;
(b) the mechanism imply that the way sunlight is reflected (the daylight of the joder) affects the temperatures, but the observed warming has been greatest at night (when the sun does not shine);
(c) there is no correlation between cosmic radiation and global temperature or precipitation;
(d) there is no contradiction between an increased greenhouse effect due to more CO2 and the hypothesis of cosmic radiation ('false dichotomy'),
http://www.springer.com/us/book/9783540306207
__________________________________________________________________
Comprehensive study shows cosmic rays are not causing global warming.
Papers on the non-significant role of cosmic rays in climate
Henrik Svensmark has proposed, (and still is, Svendsmark new paper points out that the effect is very very tiny.) that galactic cosmic rays (GCRs) could exert significant influence over global temperatures (Svensmark 1998). The theory goes that the solar magnetic field deflects GCRs, which are capable of seeding cloud formation on Earth. So if the solar magnetic field were to increase, fewer GCRs would reach Earth, seeding fewer low-level clouds, which are strongly reflective. Thus an increased solar magnetic field can indirectly decrease the Earth's albedo (reflectivity), causing the planet to warm. Therefore, in order for this theory to be plausible, all four of the following requirements must be true:
- Solar magnetic field must have a long-term positive trend.
- Galactic cosmic ray flux on Earth must have a long-term negative trend.
- Cosmic rays must successfully seed low-level clouds.
- Low-level cloud cover must have a long-term negative trend.
Fortunately we have empirical observations against which we can test these requirements.
In summary, studies have shown that GCRs exert a minor influence over low-level cloud cover, solar magnetic field has not increased in recent decades, nor has GCR flux on Earth decreased. In fact, if GCRs did have a significant impact on global temperatures, they would have had a net cooling effect over the past 50 years, especially over the past 50 years when global warming was strongest.

BONUS
The CERN project:
A comprehensive study on the CERN project concludes:
The CERN project:
A comprehensive study on the CERN project concludes:
"Recent measurements of the cosmic ray intensity show that a former decrease with time has been reversed. Thus, even if cosmic rays enhanced cloud production, there would be a small global cooling, not warming."
https://rd.springer.com/article/10.1007/s00703-013-0260-x
CLOUD researchers note that cosmic rays have little influence on the formation of sulphuric acid–amine particle formation:
"The ion-induced contribution is generally small, reflecting the high stability of sulphuric acid–dimethylamine clusters and indicating that galactic cosmic rays exert only a small influence on their formation, except at low overall formation rates."
http://www.readcube.com/articles/10.1038/nature12663
"ionising radiation such as the cosmic radiation that bombards the atmosphere from space has negligible influence on the formation rates of these particular aerosols."
https://www.nature.com/articles/nature10343
“variations in cosmic ray intensity do not appreciably affect climate through nucleation in the present-day atmosphere” and that biogenic nucleation is much more significant in cold formation.
http://science.sciencemag.org/content/354/6316/1119
Let us also hear what the main scientist behind the CERN project Jasper Kirkby says :
“At the moment, it actually says nothing about a possible cosmic-ray effect on clouds and climate,”
https://www.skepticalscience.com/cern-cloud-proves-cosmic-rays-causing-global-warming.htm
https://www.nature.com/nature/podcast/v476/n7361/nature-2011-08-25.html
MYTE #2
BLIR GLOBAL OPPVARMING MOTBEVIST AV KALDT VÆR?
Jeg har da ikke feber, jeg fryser jo sånn!
Even as climate warms, we will always have winter (cold weather, snowstorms, blizzards). Winter is related to how the Earth is tilted on its axis as it moves around the Sun.
Det er lett å blande sammen nylige værhendelser med langsiktige klimatrender, og det er vanskelig å forstå forskjellen mellom vær og klima.[...] For å finne klimatrender, så må man se på hvordan været endrer seg over et lengre tidsrom.
Gjennom å se på høye og lave temperaturer fra de siste tiår, så ser vi at nye varmerekorder inntreffer nesten dobbelt så ofte som nye kulderekorder. LES MER OM KALDE VINTRE OG GLOBAL OPPVARMING HER.
Climate sceptics often claim that recent icy winters show that global warming is not happening. New research suggests the opposite is true: As the ice melts it exposes open water which, being very much darker, absorbs more heat. The warmer water then warms the air above it which in turn, weakens the jet stream, the high level river of air which does much to determine the weather. As the jet stream slows down it meanders more, causing weather systems to get stuck in place with a “blocking pattern” that pulls cold, Arctic air down over Europe and northern Asia for long periods at a time. And, sure enough they say, recent cold winters have occurred in years when the amount of Arctic sea ice was especially low.
‘It’s too cold to snow’ — if it’s very cold, there is too little water vapor in the air to support a very heavy snowfall, and if it’s too warm, most of the precipitation will fall as rain.”[...] “Warmer air can contain more water vapor than cooler air. Global analyses show that the amount of water vapor in the atmosphere has in fact increased due to human-caused warming…. This extra moisture is available to storm systems, resulting in heavier rainfalls. Climate change also alters characteristics of the atmosphere that affect weather patterns and storms.”
Wet and dry extremes across the world will become more marked as the planet heats up, evidence from past climates shows.
The answer to the oft-asked question of whether an event is caused by climate change is that it is the wrong question. All weather events are affected by climate change because the environment in which they occur is warmer and moister than it used to be. Framing the way to relate climate extremes to climate change.
Colder Winters Don't Mean Global Warming Isn't Happening
In recent decades, the Arctic has experienced more than its fair share of warming thanks to a phenomenon called Arctic amplification. A loss of sea ice, hotter ocean currents, and increased atmospheric water vapour mean temperatures have risen twice as fast around northern latitudes. These changes have also been associated with harsher winters much further south, a knock-on effect that often confuses people who assume global warming means we can all ditch our mittens. This new research has shown how above average temperatures in the Arctic lead to lower plant growth and decreased uptake of carbon dioxide in North American ecosystems.
How Does Changing Climate Bring More Extreme Events?
The editors of a new book describe how and why weather and climate phenomena are intensifying with climate change.
Weather Patterns Are Getting Stuck as Climate Changes Affect the Jet Stream
Due to the nature of their work, climate scientists know more than the rest of us — but even they don't always agree about the ways in which climate change will affect weather in specific places. In 2012, a controversial study challenged previously accepted ideas about the mechanisms through which climate change will affect our weather: Warmer temperatures will result in more heat waves, hotter summers will bring worse droughts, the warmer atmosphere will hold more water, resulting in heavier precipitation and flooding. All of this might be true, but this study suggested that something else might be happening as well — that the relatively predictable flow of Earth's weather is changing. Due to alterations in the behavior of the jet stream, especially in the middle latitudes, weather patterns are getting "stuck" in place for longer periods, intensifying the on-the-ground effects, resulting in severe droughts, flooding and intense heat waves.
Eller som wikipedia forklarer : Den nordlige polare jetstrømmen ligger over de tett befolkede områdene i Europa, Nord-Amerika og Øst-Asia, og de viktige havene mellom disse verdensdelene. Lavtrykk med tilhørende nedbør og vind dannes ved polarfronten. Posisjonen til jetstrømmen er derfor avgjørende for været i disse områdene, og kunnskap om jetstrømmen er nødvendig for nøyaktig værvarsling. Avvik fra normal jetstrøm fører til uvanlige værsituasjoner. Sommeren 2007 lå jetstrømmen lenger sør enn vanlig. Dette førte til mye nedbør og store oversvømmelser i blant annet Storbritannia og Sør-Norge. Nord-Norge hadde derimot uvanlig varmt og tørt vær. Temperaturforskjellen driver jetstrømmen, og når forskjellen blir mindre kan jetstrømmen svekkes og buktningene bli større.


Here’s why disruptions in the polar vortex can cause temperatures to plummet in parts of the US [sic];
The polar vortex (PV) is a cyclonic (counter-clockwise) circulation in the Northern Hemisphere’s stratosphere. It acts effectively to keep Arctic air contained at high latitudes.
When the PV’s circulation is disrupted … either by displacement or splitting … Arctic air is more apt to ‘escape’ into the mid-latitudes. Where the frigid air settles in the mid-latitudes depends on the location of the displacement or split; therefore … just b/c the PV becomes disrupted doesn’t mean temperatures will necessarily plummet in parts of the U.S.
Scientists stunned by massive snowfall increases among Alaska’s highest peaks
Climate change increases the volume of precipitation, because a warmer atmosphere holds more water vapor. But it isn’t supposed to increase it this much. The researchers attribute part of the snowfall increase to the atmosphere’s retaining more water vapor, but also say that the warming up of the tropical Pacific Ocean changed atmospheric patterns, leading more storms to track across Alaska — thus accounting for the one-two punch.


http://www.climatecentral.org/gallery/maps/these-us-cities-are-getting-more-and-less-snow
Konklusjon:
En lokal kaldværsdag har ingenting å gjøre med den langsiktige trenden bestående av en økende global temperatur.
 Global warming is not the end of freezing cold winters, its a shift towards more record highs than record lows.


MYTE #3 KLIMAET HAR JO ALLTID FORANDRET SEG : CO2 NIVÅET VAR MYE HØYERE FOR ØRTEN MILLIONER ÅR SIDEN OG ALT ER SYKLUSER
"Natural cycles can only move heat around, as heat exchange within the oceans or from the oceans to the atmosphere. But now we see adding of heat both in oceans and the atmosphere. So the adding of heat to the energy budget we see now must come from somewhere else than natural cycles."
The cornerstone argument of climate change deniers is that our current warming is just a natural cycle, and this claim is usually accompanied by the statement, “the planet has warmed naturally before.” This line of reasoning is, however, seriously flawed both logically and factually. Therefore, I want to examine both the logic and the evidence to explain why this argument is faulty and why we are actually quite certain that we are the cause of our planet’s current warming.
The cornerstone argument of climate change deniers is that our current warming is just a natural cycle, and this claim is usually accompanied by the statement, “the planet has warmed naturally before.” This line of reasoning is, however, seriously flawed both logically and factually. Therefore, I want to examine both the logic and the evidence to explain why this argument is faulty and why we are actually quite certain that we are the cause of our planet’s current warming.
The fact that climate changed naturally in the past only tells us that it is possible for the climate to change naturally. It does not indicate or even suggest that the current warming is natural (i.e., this is a non-sequitur fallacy). You have to provide actual evidence that the current warming is natural.

What we have now is massively accelerated climate change, and a huge, relatively immobile population with a vested interest in fixed infrastructure, which has taken centuries of global GDP to establish. Most of humanity does not have new land to colonize. There is no capacity to reinvent farming (more than half the biological productivity of the planet) over the current time-frame of climate change.

What we have now is massively accelerated climate change, and a huge, relatively immobile population with a vested interest in fixed infrastructure, which has taken centuries of global GDP to establish. Most of humanity does not have new land to colonize. There is no capacity to reinvent farming (more than half the biological productivity of the planet) over the current time-frame of climate change.
When the Earth had warmer climates than now, humans, as a species were not present; industrial civilization, let alone agriculture had not appeared as the means of sustaining vast numbers of people. A good source for understanding why the current situation of over 400 parts per million of carbon dioxide (and other heat trapping gases) is so alarming is best examined by David Archer, The Long Thaw: How Humans are changing the next 100,000 years of Earth’s Climate, (Princeton University Press, 2009.). In brief, the problem is that the oceans (becoming more acidic) have not “caught-up” to the mass of carbon dioxide in the atmosphere. In the prehistoric past when levels of atmospheric carbon dioxide have been this high temperatures and sea level were higher than they are now.
Klimaforskeren Katharine Hayhoe forklarer:
Sammenlign den langsomme, naturlige kjølingen med den plutselige oppvarmingen som startet med den industrielle revolusjonen.Tror du det er en grunn til at endringene vi ser nå er opptil 20 ganger så brå, og i motsatt retning av den naturlige trenden?

Virkninger av dagens altfor hurtige globale oppvarming berøres av samfunn og eksisterende økosystemer som er tilpasset Holocene-klimaet i VÅR TID - IKKE klimaene og C02-nivåene som eksisterte for hundrevis av millioner år siden, og som gjerne brukte millioner av år på å forandre seg.
The effects of today's global warming will be felt by societies and existing ecosystems adapted to the Holocene climate in OUR TIME - NOT the climate and CO2 levels that existed hundreds of millions of years ago.
The geological record shows many ancient changes in climate, including massive ice ages, hot-house conditions, oxygen-free and acidic oceans, and massive extinction events. These changes happened millions of years before humans, most occurred before even primitive mammals, appeared on the scene. Previous climate changes were caused by orbital wobbles, solar fluctuations, and movement of continents. None of those effects are causing the current heating http://sks.to/past.
https://skepticalscience.com/humans-survived-past-climate-changes.htm
In the big picture, 400 ppm is a low-to-middling concentration of CO2 for the planet Earth.
Some 500 million years ago, when the number of living things in the oceans exploded and creatures first stepped on land, the ancient atmosphere happened to be rich with about 7,000 ppm of carbon dioxide. Earth was very different back then: the Sun was cooler, our planet was in a different phase of its orbital cycles, and the continents were lumped together differently, changing ocean currents and the amount of ice on land. The planet was maybe as much as 10 degrees C (18°F) warmer than today, which might seem surprisingly cool for that level of greenhouse gas; with so many factors at play, the link between CO2 and temperature isn’t always easy to see. But researchers have confirmed that CO2 was indeed a major driver of the planet’s thermostat over the past 500 million years: large continental ice sheets formed and sea levels dropped when the atmosphere was low in CO2, for example.
Thanks to earth-shaking, slow-moving forces like plate tectonics, mountain building, and rock weathering — which absorb CO2 — atmospheric concentration of CO2 generally declined by about 13 ppm per million years, with a few major wobbles. As large plants evolved and became common about 350 million years ago, for example, their roots dug into the ground and sped up weathering processes that trap atmospheric carbon in rocks like limestone. This might have triggered a massive dip in CO2 levels and a glaciation 300 million years ago. That was eventually followed by a period of massive volcanic activity as the supercontinent ripped apart, spewing out enough CO2 to more than double its concentration in the air.
The last time the planet had a concentration of 300 to 400 ppm of CO2 in the atmosphere was during the mid-Pliocene, 3 million years ago — recently enough for the planet to be not radically different than it is today. Back then, temperatures were 2 degrees C to 3 degrees C (3.6 to 5.4°F) above pre-industrial temperatures (though more than 10 degrees C hotter in the Arctic), and sea levels were at least 15-25 meters higher. Forest grew in the Canadian north and grasslands abounded worldwide; the Sahara was probably covered in vegetation. Homo habilis (aka “handy man”), the first species in the Homo line and probably the first stone-tool users, got a taste of this climate as they arrived on the scene 2.8 million years ago. (Homo sapiens didn’t show up until 400,000 years ago at the earliest.)
To find a time when the planet’s air was consistently above 400 ppm you have to look much farther back to the warm part of the Miocene, some 16 million years ago, or the Early Oligocene, about 25 million years ago, when Earth was a very different place and its climate totally dissimilar from what we might expect today.
There’s a lot of debate about both temperatures and CO2 levels from millions of years ago. But the evidence is much firmer for the last 800,000 years, when ice cores show that CO2 concentrations stayed tight between 180 and 290 ppm, hovering at around 280 ppm for some 10,000 years before the industrial revolution hit. (There have been eight glacial cycles over these past 800,000 years, mostly driven by wobbles in the Earth’s orbit that run on 41,000 and 100,000 year timescales). This is the benchmark against which scientists usually note the unprecedented modern rise of CO2.
Frighteningly, this modern rise of CO2 is also accelerating at an unusual rate. In the late 1950s, the annual rate of increase was about 0.7 ppm per year; from 2005-2014 it was about 2.1 ppm per year.
Paleo records hint that it usually takes much longer to shift CO2 concentrations in the atmosphere; although researchers can’t see what happened on time frames as short as decades in the distant past, the fastest blips they can see were an order of magnitude slower than what’s happening today. These were typically associated with some major stress like a mass extinction, notes Dana Royer, a climatologist at Wesleyan University. During the end-Triassic extinction 200 million years ago, for example, CO2 values jumpedfrom about 1,300 ppm to 3,500 ppm thanks to massive volcanic eruptions in what is now the central Atlantic. That took somewhere between 1,000 to 20,000 years. Today we could conceivably change our atmosphere by thousands of parts per million in just a couple of hundred years. There’s nothing anywhere near that in the ice core records, says Keeling.
The amount of CO2 and O2 in the atmosphere over long timescales (> 105years) is largely controlled by several key processes. Reconstruction of atmospheric CO2 and O2in the geologic past can be accomplished either with proxies or by modeling the long-term carbon and sulfur cycles. Application of these two independent approaches yields similar results. CO2 was high during the early Paleozoic (> 2000 ppm) and parts of the Mesozoic (~ 1000 ppm) but low during the Carboniferous, Permian, and late Cenozoic (< 500 ppm). These CO2 patterns are strongly coupled to independent evidence for global temperature. O2 records show oscillating values (15–25%) with a distinct peak (> 30%) during the Permian. There is a compelling link between this Phanerozoic peak in atmospheric O2 and a concomitant interval of insect gigantism.
Additionally, we have carefully examined the sun, volcanoes, Milankovitch cycles, etc. and none of them can explain the current warming trend (Meehl, et al. 2004; Wild et al. 2007; Lockwood and Frohlich 2007, 2008; Lean and Rind 2008; Foster and Rahmstorf 2011; Imbers et al. 2014). Indeed, numerous studies have used statistical models to examine the possibility that the current warming is natural, and they have consistently found that natural factors alone cannot explain the current warming. When you add anthropogenic greenhouse gasses into the statistical models, however, you get a tight match between the observed and expected values (Stott et al. 2001; Meehl et al. 2004; Allen et al. 2006; Lean and Rind 2008; Imbers et al. 2014). To put it simply, we have tested the natural factors and we have tested the anthropogenic factors, and the anthropogenic factors are necessary to explain the warming trend. This is extremely clear evidence that we are the cause. Additionally, several studies have found that CO2 was actually the major driver of past climate change (Lorius et al. 1990; Tripati et al. 2009; Shakun et al. 2012), so it should hardly be surprising that we can cause the climate to change by producing CO2.
I short, we know that the current warming is not natural because we have tested that hypothesis and it failed. That is how science works. When a hypothesis fails, you reject it and move on.
I alle tilfeller ser vi den samme sammenhengen mellom CO2-nivå og globale temperaturer. Og tidligere eksempler på raske karbonutslipp (akkurat som i dag) var generelt svært ødeleggende for livet på jorden. Ancient natural cycles are irrelevant for attributing recent global warming to humans.
Of course, modern global warming stems from a clear cause—rising levels of CO2 (and other greenhouse gases) from fossil fuel burning, cutting down forests and other human activities. And, in the past rising CO2 levels at the very least magnified global warming, ushering in the relatively balmy, stable climate sometimes called the "long summer" that has allowed human civilization to flourish. Humanity has now raised global CO2 levels by more than the rise from roughly 180 to 260 ppm at the end of the last ice age, albeit in a few hundred years rather than over more than a few thousand years. "The end of an ice age, you have a sense in your bones what that means: a big, significant change for the planet," Shakun says. "It's a tangible example of what rising CO2 can mean for the planet over the long-term."
Vår venn potholer54, som blir beskrevet slik av RationalWiki:
"Potholer is a well-known defender of climate change facts and has made many excellent rebuttal videos explaining when and where denialists are wrong. Potholer explains how greenhouse gases work, looks at alternative theories to climate change, and debunks the huge number of urban myths that are zipping round the Internet,"
oppklarer:
During the Ordovician, solar output was 4% lower than current levels, and there was a large continent over the South Pole. Consequently, CO2 levels at around 1,000 to 2,300 ppm were actually low enough to promote glaciation in the southern continent of Gondwana. Ample geological and geochemical evidence points to strong weathering in parallel with the cooling of the Ordovician climate. Since rock weathering reduces atmospheric CO2, this again reinforces the scientific fact that CO2 is a strong driver of climate.
"Climate change has occurred naturally in the past. But that doesn’t mean natural causes are responsible this time.
lley pointed out the logical flaw in this oft-repeated argument: It’s like saying that since wildfires sometimes begin with natural events like lightning strikes they can never be caused by a wayward campfire".
The widespread sea ice prevents the deposition of fresh carbonates in ocean sediment. Since such carbonates are part of the natural process for recycling carbon dioxide, short-circuiting this process allows carbon dioxide to accumulate in the atmosphere. This increases the greenhouse effect and eventually leads to higher temperatures and the retreat of sea ice.Scientists believe a series of large volcanic eruptions about 201 million years ago were the cause.These eruptions left huge lava flows along the edges of the North Atlantic and released a lot of CO2 into the atmosphere. Huge quantities of this greenhouse gas triggered global warming, which in turn melted ice that contained trapped methane and led to further warming. Increasing CO2 concentrations would also have made the oceans more acidic, another possible cause of the mass extinction.
Climate Change from the Cambrian to the Ice Ages (2014 Lecture)
Konklusjon:
Ingen naturlige variasjoner kan forklare den hurtige oppvarmingen vi opplever nå.
Ingen naturlige variasjoner kan forklare den hurtige oppvarmingen vi opplever nå.
MYTE #4
KLIMASENSITIVITETEN ER LAV
A new study by Kate Marvel, Gavin Schmidt, Ron Miller, and Larissa Nazarenko at the NASA Goddard Institute for Space Studies appears to have found the answer. They drew upon previous research by Drew Shindell and Kummer & Dessler, who identified a flaw in studies taking the energy budget approach. Those studies had assumed that the Earth’s climate is equally sensitive to all forcings.In reality, as world-renowned climate scientist James Hansen noted in a 1997 paper, some forcings are more efficient at causing the Earth’s surface temperature to change than others. Those in which the effects are focused in the northern hemisphere tend to be more efficient, for example. [...] The NASA study shows that the previous estimates were indeed biased low, and correcting for that bias brings them into agreement with estimates using other approaches. A number of independent studies using near-global satellite data find positive feedbackand high climate sensitivity. [...] Climate sensitivity is a measure of how much our climate responds to an energy imbalance. The most common definition is the change in global temperature if the amount of atmospheric CO2 was doubled. If there were no feedbacks, climate sensitivity would be around 1°C. But we know there are a number of feedbacks, both positive and negative. So how do we determine the net feedback? An empirical solution is to observe how our climateresponds to temperature change. We have satellite measurements of the radiation budget and surface measurements of temperature. Putting the two together should give us an indication of net feedback.
Less than 2 °C warming by 2100 unlikely The likely range of global temperature increase is 2.0–4.9 °C, with median 3.2 °C and a 5% (1%) chance that it will be less than 2 °C (1.5 °C). Population growth is not a major contributing factor. Our model is not a ‘business as usual’ scenario, but rather is based on data which already show the effect of emission mitigation policies.Net positive feedback is confirmed by many different lines of evidence.
A Less Cloudy Future: The Role of Subtropical Subsidence in Climate Sensitivity
The Impact of Global Warming on Marine Boundary Layer Clouds over the Eastern Pacific—A Regional Model Study
Greater future global warming inferred from Earth’s recent energy budget.
Tan I, Storelvmo T, and Zelinka MD: Observational constraints on mixed-phase clouds imply higher climate sensitivity. Science 352(6282):224–27, 2016.
Shaffer G, Huber M, Rondanelli R, and Pepke Pedersen JO: Deep-time evidence for climate sensitivity increase with warming. Geophysical Research Letters 43(12):6538–45, 2016.
Armour KC: Energy budget constraints on climate sensitivity in light of inconstant climate feedbacks. Nature Climate Change 7(5):331–35, 2017
The most likely value of ECS constrained by different lines of evidence is 3 °C, not lower than that.Knutti R, Rugenstein MA, and Hegerl GC: Beyond equilibrium climate sensitivity. Nature Geoscience 10:727–736, 2017.
Greater future global warming inferred from Earth’s recent energy budgethttps://www.nature.com/articles/nature24672
On the Accuracy of Deriving Climate Feedback Parameters from Correlations between Surface Temperature and Outgoing Radiation Relationships between tropical sea surface temperature and top-of-atmosphere radiation.
Cloud variations and the Earth's energy budget
All the models and evidence confirm a minimum warming close to 2°C for a doubling of atmospheric CO2 with a most likely value of 3°C and the potential to warm 4.5°C or even more. Even such a small rise would signal many damaging and highly disruptive changes to the environment. In this light, the arguments against reducing greenhouse gas emissions because of climate sensitivity are a form of gambling.
OKTOBER 2017
NASA MED NY VITEN OM NATURLIG FEEDBACK
NASA MED NY VITEN OM NATURLIG FEEDBACK
NASA pinpoints cause of Earth's recent record carbon dioxide spike
"Understanding how the carbon cycle in these regions responded to El Nino will enable scientists to improve carbon cycle models, which should lead to improved predictions of how our planet may respond to similar conditions in the future," said OCO-2 Deputy Project Scientist Annmarie Eldering of JPL.
"The team's findings imply that if future climate brings more or longer droughts, as the last El Nino did, more carbon dioxide may remain in the atmosphere, leading to a tendency to further warm Earth."[...]
Scott Denning, professor of atmospheric science at Colorado State University in Fort Collins and an OCO-2 science team member who was not part of this study, noted that while scientists have known for decades that El Nino influences the productivity of tropical forests and, therefore, the forests' net contributions to atmospheric carbon dioxide, researchers have had very few direct observations of the effects.
"OCO-2 has given us two revolutionary new ways to understand the effects of drought and heat on tropical forests: directly measuring carbon dioxide over these regions thousands of times a day; and sensing the rate of photosynthesis by detecting fluorescence from chlorophyll in the trees themselves," said Denning. "We can use these data to test our understanding of whether the response of tropical forests is likely to make climate change worse or not."
Januar 2018:
Ifølge en ny studie vil temperaturen på jorda ikke øke med så mye som 4–5 grader innen år 2100, slik tidligere beregninger har vist. Studien, publisert i det anerkjente forskningsmagasinet Nature, viser at temperaturen vil øke med maksimalt 3,4 grader på grunn av utslipp av drivhusgasser. Det handler om raske feedbacks, som vanndamp m.m., og de sier tydelig at de vet at de ikke får med de lengre tilbakekoblingene når de bare ser på 150 år med data.
Men tallene er fremdeles urovekkende høye:
Cox and colleagues, using a new methodology, have come up with a far narrower range: 2.2C to 3.4C, with a best estimate of 2.8C.
The claim of reduced uncertainty for equilibrium climate sensitivity is premature
A recent story in the Guardian claims that new calculations reduce the uncertainty associated with a global warming:
A revised calculation of how greenhouse gases drive up the planet’s temperature reduces the range of possible end-of-century outcomes by more than half, …
It was based on a study recently published in Nature (Cox et al. 2018), however, I think its conclusions are premature.
The calculations in question involved both an over-simplification and a set of assumptions which limit their precision, if applied to Earth’s real climate system.
"Problemet er at ulike tilbakevirkende effekter omfatter ulike tidsskala, og en analyse basert på et begrenset tidsrom kan skape et inntrykk som ikke gjenspeiler effekten over lenger tid.
Det er to ting som er viktige for å forstå studien: (1) den voldsomme forenklingen som kun gir et pekepin og (2) at ulike tilbakevirkninger (feedbacls) kan ha ulike tidsskalaer (og da er ikke alltid autokorrelasjonen så veldig beskrivende)" . (R.Benestad.)
MYTE #5
VULKANER ER C02-VERSTINGER
Vulkaner bidrar ikke med spesielt mye CO2-utslipp i forhold til menneskelig aktivitet. På 3-5 dager slipper menneskene ut like mye CO2 som verdens vulkaner produserer på et helt år.[...] Menneskeskapte utslipp av CO2 er 135 ganger større enn vulkaners utslipp. Det er konklusjonen i en artikkel i tidsskriftet Eos, som gis ut av American Geophysical Union (AGU). Dersom verdens vulkaner skulle ha sluppet ut mer enn det menneskene gjør nå, måtte det ha vært mye større magma-produksjon i verden, og magmaen måtte ha inneholdt mer enn 30 prosent CO2 sier Terrance Gerlach i U.S. Geological Survey. Her er rapporten hans som bekrefter tallene. How do
scientists know that Mauna Loa's volcanic emissions don't affect the carbon dioxide data collected there?
All studies to date of global volcanic carbon dioxide emissions indicate that present-day subaerial and submarine volcanoes release less than a percent of the carbon dioxide released currently by human activities.
https://volcanoes.usgs.gov/vhp/gas_climate.html
In order for underwater volcanic activity to warm the ocean, they would have to be erupting on orders of magnitude larger than observed. This also would be affecting the acidification of the ocean, which we know is derived from human FF usages. Per Gerlach 2011:
"To create more than 35 gigatons per year of volcanic CO2 would require that magma across the globe be produced in amounts exceeding 850 cubic kilometers per year, even for magma hypothetically containing 1.5-weight-percent CO2. It is implausible that this much magma production—more than 40 times the annual midocean ridge magma supply—is going unnoticed, on land or beneath the sea. Besides, the release of more than 35 gigatons per year of volcanic CO2 into the ocean would overwhelm the observed acid-buffering capacity of seawater and contradict seawater’s role as a major sink for atmospheric CO2 [Walker, 1983; Khatiwala et al., 2009]. In short, the belief that volcanic CO2exceeds anthropogenic CO2 implies either unbelievable volumes of magma production or unbelievable concentrations of magmatic CO2. These dilemmas and their related problematic implications corroborate the observational evidence that volcanoes emit far less CO2 than human activities.

https://skepticalscience.com/coming-out-of-ice-age-volcanoes.htm
It is informative to calculate volcanic analogs that elucidate the size of humanity’s carbon footprint by scaling up volcanism to the hypothetical intensity required to generate CO2 emissions at anthropogenic levels. For example, using the 2010 ACM factor of 135 (Figure 1) to scale up features of present-day volcanism, Kilauea volcano scales up to the equivalent of 135 Kilauea volcanoes; scaling up all active subaerial volcanoes evokes a landscape with the equivalent of about 9500 active present-day volcanoes [Siebert et al., 2010]. Similarly, the seafloor mid-ocean ridge system scales up to the equivalent of 135 such systems. Of particular interest, though, is the roughly 4 cubic kilometers per year of current global volcanic magma production [Crisp, 1984], which would scale up to about 540 cubic kilometers per year. This significantly exceeds the estimated average magma output rates of continental flood basalt volcanism [Self, 2010], which range from about 10 to 100 cubic kilometers per year. Thus, annual anthropogenic CO2 emissions may already exceed the annual CO2 emissions of several continental flood basalt eruptions, consistent with the findings of Self et al. [2005]."
https://volcanoes.usgs.gov/vhp/gas_climate.html
http://onlinelibrary.wiley.com/doi/10.1029/2011EO240001/abstract
https://web.archive.org/web/20130125003028/http://www.agu.org/pubs/pdf/2011EO240001.pdf
http://www.agu.org/pubs/pdf/2011EO240001.pdf
http://www.skepticalscience.com/news.php?n=2932#110799
All studies to date of global volcanic carbon dioxide emissions indicate that present-day subaerial and submarine volcanoes release less than a percent of the carbon dioxide released currently by human activities.
En islandsk vulkan ga oss bekreftelsen.
The late-twentieth-century warming can only be reproduced in the model with anthropogenic forcing (mainly GHGs).
Spaceborne measurements of atmospheric CO2 using kilometer-scale data from NASA’s Orbiting Carbon Observatory-2 (OCO-2) reveal distinct structures caused by known anthropogenic and natural point sources, including megacities and volcanoes.
Hva sier faktasjekkerne?
The Significant Increase in Volcano Eruptions DEBUNKED:
MYTE #6
GRØNNLANDSISEN VOKSER
Greenland on the whole is losing ice, as confirmed by multiple satellite and on the ground field measurement. In conclusion Greenland is losing ice extensively along its margins where fast flowing ice streams are pushing more ice into the ocean than is gained in the center of the ice sheet.Stemmer dette? La oss høre direkte med ekspertene:
Danmarks Meterologiske Institutt bekrefter nedgangen de siste 10-årene; "Satellite observations over the last decade show that the ice sheet is not in balance. The calving loss is greater than the gain from surface mass balance, and Greenland is losing mass at about 200 Gt/yr."
NATIONAL SNOW AND ICE CENTER: The 2016 total summer melt extent area (the sum of surface melt area for each day for June, July, and August) was 36 million square kilometers (13.9 million square miles), tenth largest in the 1978 to 2015 period (tied with 2004)
NOAA: Greenland ice mass loss continued in 2016.
NASA: Data from NASA's GRACE satellites show that the land ice sheets in both Antarctica(upper chart) and Greenland (lower) have been losing mass since 2002. Both ice sheets have seen an acceleration of ice mass loss since 2009. (Source: GRACE satellite data)Thanks to rising temperatures, glaciers in Greenland are melting faster than scientists previously thought — and a new NASA video shows how researchers are tracking the magnitude of the changes (in feet per day).
Using data from satellites, flow sensors, and the ice surface, scientists have estimated and modeled ice loss from the Greenland Ice Sheet since 1900. Using a simple elastic model, we estimate that western Greenland’s ice loss is accelerating at an average rate of 8.7±3.5 Gt yr−2, whereas the rate for southeastern Greenland—based on limited data—falls at 12.5±5.5 Gt yr−2. Increasing rates of ice mass loss from the Greenland and Antarctic ice sheets revealed by GRACE.Melting of the Greenland ice sheet (GrIS) and its peripheral glaciers and ice caps (GICs) contributes about 43% to contemporary sea level rise.

Gravity is putting its thumb on the scale of sea level rise along the U.S. East Coast, a study tracing the effects of Greenland ice-melt shows.
Scientists using ice-penetrating radar data collected by NASA’s Operation IceBridge and earlier airborne campaigns have built the first-ever comprehensive map of layers deep inside the Greenland Ice Sheet. During the last glacial period, within only a few decades the influence of atmospheric CO2 on the North Atlantic circulation resulted in temperature increases of up to 10 degrees Celsius in Greenland -- as indicated by new climate calculations.
Forskere som nylig har studert Grønnlandsisens dynamikk bekrefter nedgangen: Hovedmannen bak studien Dr Joseph MacGregor, researcher at the University of Texas, sier: “it does not change the fact that the ice sheet is losing mass overall. ‘The ice growth does not offset the overall loss by much,’ says MacGregor, however the slow thickening – at typically less than one cm per year – is widespread across the interior of the ice sheet, so it’s important to understand the origins of the phenomenon.’ ‘Reconciling these observations is critical to predicting the future of the Greenland ice sheet amid ongoing climate change,’ the study concludes.” En av de andre forskerne bak studien utdyper: "The ice sheet as a whole is still losing a tremendous amount of mass. But what we see here is the fingerprint of how the ice sheet is still responding to processes that were kick-started millennia ago, at the start of the last deglaciation,[...] Melt due to contemporary climate change is really concentrated around the edges of the ice sheet. Here the ice sheet is thinning and glaciers are flowing faster into the sea and we’re losing hundreds of gigatons of ice each year,” says Colgan. William Colgan, guest researcher at the Geological Survey of Denmark and Greenland (GEUS) and assistant professor in the Department of Earth and Space Science and Engineering at York University in Toronto, Canada.
Surprise Lake Sheds Light on Underbelly of Greenland Ice
Two Maps Show Greenland’s Sudden Melt Season Onset
Greenland Sediment Sheds Light on Sea Level Rise
Atlantic Circulation Weaker Than In Last Thousand Years
Dire Climate Warning Raises Questions, Not Answers
And from last year:
Greenland’s Ice Sheet Shifts Could Speed Melt
Dust in the Wind Could Speed Greenland’s Ice Melt
Greenland’s Fastest-Flowing Glacier Speeds Up
Fate of Earth’s Ice Comes Further Into Focus
For de som trenger mer grønnlandsis-nerding, her er to videoer som oppsummerer
MYTE #7
DEN ARKTISKE SJØISEN VOKSER
Eight trillion tonnes of Arctic ice lost since 1971
Det er viktig å skille mellom Arktis og Antarktis, sjøis og landis. Mister vi mer enn det gror? ja, det gjør vi. Det er alltid smart å sjekke med dem som faktisk forsker på is. Hør direkte med dem som jobber med dette til daglig. Ikke gå til bloggere, ikke gå til politikere. Ikke bruk tankesmie-"eksperter". Hør med fagfolkene. I dette tilfellet f.eks NASA eller National Snow & Ice Data Center. Sistnevnte har daglige oppdateringer. Hva sier de om den langsiktige trenden? Det interessante her er at det var en kraftig vekst i isen, to ganger, fra ca 1989 til 1999. Også i 2017 ser vi en vekst, men det er altså den langsiktige trenden vi må se på. April 2017 compared to previous years:


POLAR SCIENCE CENTER:
 Sea Ice Volume is calculated using the Pan-Arctic Ice Ocean Modeling and Assimilation System (PIOMAS, Zhang and Rothrock, 2003) developed at APL/PSC. Anomalies for each day are calculated relative to the average over the 1979 -2016 period for that day of the year to remove the annual cycle.

In reality, 2017 was the eighth lowest year on record for Arctic sea ice extent since satellite measurements began in 1978. But in no world but the pseudo-scientific fringe internet would the concept of global warming rely on every single year breaking the previous year’s record for sea ice minimum.
Variability and trends in the Arctic Sea ice cover: Results from different techniques
Key points of the article include:
● Sea ice extent and area trends from four sea ice products are compared and shown to provide similar assessments of interannual variability and trends.
● Significant discrepancies in the spatial distribution of ice concentration are observed especially in the seasonal regions and melt-ponded areas in summer.
[Despite this] ● Results from all four products consistently confirm a continuation of the rapid decline of the Arctic perennial ice cover.
The same techniques are used for measuring Antarctic sea ice.

Here's a study looking at the attribution of Arctic sea ice loss:
Mueller
2018 - Attribution of Arctic sea ice decline from 1953 to 2012 to
influences from natural, greenhouse-gas and anthropogenic aerosol
forcing
Takeaways:
1. Fingerprints from greenhouse-gas, natural and other anthropogenic forcings are detected in the three observed records of Arctic sea ice extent.
2. The best estimate of the trend attributable to NAT [known natural-only forcing] forcing is roughly zero which is consistent with the expectation of quasi-random long term forcing variability.
3. The trend attributable to GHG forcing is more negative than the observed negative trend of Arctic sea ice decline in the WC data.
4. For the 1953 to 2012 period roughly 23% of the greenhouse-gas induced negative sea ice trend has been offset by a weak positive sea ice trend attributable to other anthropogenic forcing.
5. OANT [other anthropogenic forcing agents, mainly aerosols] has offset about 30% of the decline that would have been expected in the absence of OANT forcing due to the combined climate response from GHG and NAT forcing. Future reduction of aerosol emissions may result in additional sea ice decline due to the reduced cooling effect.
6. If technological advance and pollution control politics will reverse global aerosols burden it may be that whatever GHG-induced atmospheric warming has been masked by the rising levels of aerosols will then be exposed.
From NOAA's December 12, 2017 Arctic Report Card:: Sea ice loss "is beyond the range of natural variability, implying a human component to the drastic decrease observed in the records."
"This time series shows the Arctic sea ice extent in millions of square kilometers over the past roughly 1,500 years. Scientists use climate proxies like sediment/ice cores, tree rings, and fossilized shells of ocean creatures to extend the sea ice extent records back in time. These records show that while there have been several periods over the past 1,450 years when sea ice extents expanded and contracted, the decrease during the modern era is unrivaled. And just as importantly, it is beyond the range of natural variability, implying a human component to the drastic decrease observed in the records.
"The minimum sea ice extent, which occurs each summer, is influenced by the atmospheric circulation, air temperature, and variations in the amount of warm water that flows into the Arctic. Since 1900, waters that enter the Arctic Ocean through the Fram Strait have increased by 2 degrees Celsius (4 degrees Fahrenheit). Meanwhile, proxy records show that the current warming trend in surface air temperatures has not been observed in the Arctic over at least the last 2,000 years."

https://science2017.globalchange.gov/chapter/11/
https://www.youtube.com/watch?v=6ZAuRpK4tkc
http://sites.uci.edu/zlabe/arctic-sea-ice-volumethickness/

Klimaforskere og klimatåkeleggerne leser grafene om tilbakegangen til sjøisen i Arktis på to helt forskjellige måter. Her er hvordan skeptikere ser grafen: de kirsebærplukker de røde strekene og bruker de til å si at sjøisen vokser - noe som forsåvidt er riktig - men forventet innenfor en syklus av naturlige variasjoner.

Her er den riktige - langsiktige - måten å se på grafen: 

CALGARY, Alberta (Reuters) - Arctic sea ice may be thinning faster than predicted because salty snow on the surface of the ice skews the accuracy of satellite measurements, a new study from the University of Calgary said.
“Hver gang noen kan peke til en kortvarig periode hvor utbredelsen av is har vokst, eller temperaturøkningen har stagnert, så kommer klimafornekterne på banen og forteller oss at klimaproblemene bare er tull og at alt er i skjønneste orden. Bare se, temperaturene synker jo og isen vokser! Men slike kortvarige sykluser er som forventet. Det vi må se på er den langsiktige trenden, og den viser tydelig at utbredelsen av is i Arktis minsker over tid”. Skeptikeren og forfatteren Gunnar Tjomlid og hans blogg Saksynt tar for seg disse grafene og mange andre klimaløgner og myter her. Virkelig verdt en titt.
Cherry-picking is one of the five telltale techniques of climate change denial. By focusing on short-term blips in noisy data, those who want to maintain the status quo can distract from the long-term threats posed by climate change. Climate contrarians most frequently deploy this strategy using global temperature and Arctic sea ice data.
A recent study in Nature Geoscience concluded that, not surprisingly, there is a strong relationship between the summer temperatures in the Arctic (specifically the number of “melting degree days”), and the amount of sea ice that melts in a given year.
Fersk rapport fra Nordområdene ute i april 2017: "Arctic temperatures are rising faster than the global average. The Arctic was warmer from 2011 to 2015 than at any time since instrumental records began in around 1900, and has been warming more than twice as rapidly as the world as a whole for the past 50 years. January 2016 in the Arctic was 5°C warmer than the 1981–2010 average for the region, a full 2°C higher than the previous record set in 2008, and monthly mean temperatures in October through December 2016 were 6°C higher than average for these months. Sea temperatures are also increasing, both near the surface and in deeper water"
2016 var både et rekordvarmt og rekordvått år på Svalbard. Årsmiddeltemperaturen var -0,1 grader, 6,5 grader over normalen for året. Nedbøren var på 310 mm som er 163p prosent av normalen. Værstasjonen på Svalbard lufthavn har ikke hatt temperaturer under normalen etter november 2010, for 77 måneder siden.
Arctic sea ice loss is three times greater than Antarctic sea ice gain.
The Arctic sea ice maximum extent and Antarctic minimum extent are both record lows this year. Combined, sea ice numbers are at their lowest point since satellites began to continuously measure sea ice in 1979.
Hva sier IPPC? På side 1 i AR5 konkluderer de:
"The annual mean Arctic sea-ice extent decreased over the period 1979 to 2012, with a rate that was very likely in the range 3.5 to 4.1% per decade. Arctic sea-ice extent has decreased in every season and in every successive decade since 1979, with the most rapid decrease in decadal mean extent in summer (high confidence). It is very likely that the annual mean Antarctic sea-ice extent increased in the range of 1.2 to 1.8% per decade between 1979 and 2012.
However, there is high confidence that there are strong regional differences in Antarctica, with extent increasing in some regions and decreasing in others."
Studies suggest that the decline in summer Arctic sea ice has been steeper since the late 20th century than at any time in the past 1,450 years. Loss of Arctic sea ice impacting Atlantic Ocean water circulation system.
Verdens ledende faktasjekker, Snopes: Global Sea Ice at a record breaking low.
Temperaturdata for Arktis:

http://sites.uci.edu/zlabe/arctic-temperatures/
Shi et al covers the last 1,400 years of summer temperatures in the Arctic
Shi et al 2012 - Multi-proxy reconstruction of Arctic summer temperatures over the past 1400 years

BONUS:
Why there is so much variation in the year to year trend in Arctic sea ice cover. The reason, of course, is that more than just the overall rise in global temperatures affect Arctic sea ice extent. The big drops in Arctic sea ice extent occurred in years with favorable atmospheric conditions during the bulk of the melt season (May-August). The last several years have seen conditions unfavorable for the same to happen, with an apparent slowing of the overall downward trend. Additionally, aerosols from human industrial activity have acted to offset local warming (and attendant sea ice melt) by reducing the amount of sunlight reaching the surface in the Arctic summer melt season:
Mueller 2018 - Attribution of Arctic sea ice decline from 1953 to 2012 to influences from natural, greenhouse-gas and anthropogenic aerosol forcing
Takeaways:
1. Fingerprints from greenhouse-gas, natural and other anthropogenic forcings are detected in the three observed records of Arctic sea ice extent.
2. The best estimate of the trend attributable to NAT [known natural-only forcing] forcing is roughly zero which is consistent with the expectation of quasi-random long term forcing variability.
3. The trend attributable to GHG forcing is more negative than the observed negative trend of Arctic sea ice decline in the WC data.
4. For the 1953 to 2012 period roughly 23% of the greenhouse-gas induced negative sea ice trend has been offset by a weak positive sea ice trend attributable to other anthropogenic forcing.
5. OANT [other anthropogenic forcing agents, mainly aerosols] has offset about 30% of the decline that would have been expected in the absence of OANT forcing due to the combined climate response from GHG and NAT forcing. Future reduction of aerosol emissions may result in additional sea ice decline due to the reduced cooling effect.
6. If technological advance and pollution control politics will reverse global aerosols burden it may be that whatever GHG-induced atmospheric warming has been masked by the rising levels of aerosols will then be exposed.
MYTE #8
HVA MED ANTARKTIS?
But glacier scientists at NASA have recently found that East Antarctica, too, is systematically shedding ice, if not as quickly as West Antarctica. For example, Totten Glacier, East Antartica's largest, has shrunk by a quarter of a meter a year since 2009, a rate that's twice as fast as before, according to the Earth Observatory. Glacial melting contributes to sea-level rise, which in turn creates more frequent flooding worldwide.
How Climate Change Is Affecting Glaciers Around the World
A NASA study based on an innovative technique for crunching torrents of satellite data provides the clearest picture yet of changes in Antarctic ice flow into the ocean. The findings confirm accelerating ice losses from the West Antarctic Ice Sheet and reveal surprisingly steady rates of flow from its much larger neighbor to the east. The computer-vision technique crunched data from hundreds of thousands of NASA-U.S. Geological Survey Landsat satellite images to produce a high-precision picture of changes in ice-sheet motion.
"Including modeled rates of snow accumulation and basal melt, the Antarctic ice sheet lost ice at an average rate of 183 ± 94 Gt yr−1 between 2008 and 2015."
https://www.the-cryosphere.net/12/521/2018/tc-12-521-2018-discussion.html
https://www.the-cryosphere.net/12/521/2018/tc-12-521-2018-discussion.html
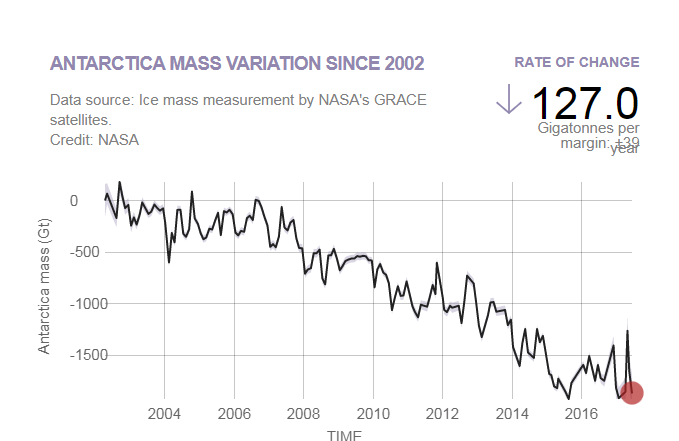
Accelerated West Antarctic ice mass loss continues to outpace East Antarctic gains
They describe the West Antarctic Ice Sheet (WAIS) as having experienced significant and sustained ice loss until 7,500 years ago, driven by warm water incursions. The influx of warm water then subsided for several thousands of years until it was reinvigorated in the 1940s, driving further retreat.

https://earther.com/more-evidence-that-west-antarcticas-glaciers-are-in-ter-1822590432?utm_content=buffer623b2&utm_medium=social&utm_source=facebook.com&utm_campaign=buffer
New study reveals when West Antarctica's largest glacier started retreating.
New study reveals when West Antarctica's largest glacier started retreating.
Satellites Track Vanishing Antarctic Ice
Special issue of journal Nature on Antarctica suggests long-term decline of sea ice, posits new scenarios for continent’s future
Scientists from the University of Leeds, the University of California San Diego, and University of Maryland reviewed decades of satellite measurements to reveal how and why Antarctica’s glaciers, ice shelves, and sea ice are changing.
Their report, published June 14 in a special issue of the journal Nature on Antarctica, explains how ice shelf thinning and collapse have triggered an increase in the continent’s sea level contribution. The study “Trends and connections across the Antarctic cryosphere” also explains that although the total area of sea ice surrounding Antarctica has shown little overall change during the satellite era, there are signs of a longer-term decline when mid-twentieth century ship-based observations are considered.
Helen Amanda Fricker, a glaciologist at Scripps Institution of Oceanography at UC San Diego, contributed to that study. She is also a co-author of a review paper in the same issue that considers the consequences for Antarctica’s future under two climate scenarios.
“Even though Antarctica is far from most human civilization, its ice sheet is losing mass to the ocean, and is an increasing contribution to sea-level rise, which will have large impacts on coastlines all around all the world,” said Fricker, who is currently on sabbatical at the Institute of Marine and Antarctic Science in Hobart, Australia. “The future we choose could determine when we need to rebuild airports, cities and infrastructure so that we can become resilient to such changes.”
Satellite observations have meanwhile provided an increasingly detailed picture of the sea ice cover, allowing scientists to map the extent, age, motion and thickness of the ice.
Antarctica’s Sea Ice Shrinks to New Record Low
Professor David Vaughan, co-author and Director of Science at British Antarctic Survey, says:
"Ice loss from this part of West Antarctica is already making a very significant contribution to global sea level rise, and is actually one of the largest uncertainties in global sea-level predictions. Understanding what initiated the current changes is one major piece of the jigsaw, and now we are already looking for the next—how long will these changes continue and how much ice will Pine Island Glacier and its neighbours lose in the coming century.
Antarctica’s Ice-Free Areas to Increase By 2100
Antarctica’s Ice-Free Areas to Increase By 2100
Climate change will cause ice-free areas on Antarctica to increase by up to a quarter by 2100, threatening the diversity of the unique terrestrial plant and animal life that exists there, according to projections from the first study examining the question in detail.Antarctica’s pristine ice-white environment is going green and facing an unexpected threat – from the common house fly. Scientists say that as temperatures soar in the polar region, invading plants and insects, including the fly, pose a major conservation threat.[...] "It now has an increasing chance of surviving in the Antarctic as it warms up, and that is a worry. Insects like the fly carry pathogens that could have a devastating effect on indigenous lifeforms.”
More precise measurements show West Antarctica ice melt accelerating
https://phys.org/news/2018-02-precise-west-antarctica-ice.html
Scientists confirm that warm ocean water is melting the biggest glacier in East Antarctica

Nasa says it has detected the first signs of significant melting in a swathe of glaciers in East Antarctica.
The region has long been considered stable and unaffected by some of the more dramatic changes occurring elsewhere on the continent.
But satellites have now shown that ice streams running into the ocean along one-eighth of the eastern coastline have thinned and sped up.
If this trend continues, it has consequences for future sea levels.
There is enough ice in the drainage basins in this sector of Antarctica to raise the height of the global oceans by 28m - if it were all to melt out."That's the water equivalent to four Greenlands of ice," said Catherine Walker from Nasa's Goddard Space Flight Center in Greenbelt, Maryland.

Study shows global sea ice diminishing, despite Antarctic gains
Rather, the researchers found that snow accumulation is adding more ice to East Antarctica (the huge chunk of the continent to the east of the Transantarctic Mountains) and the interior region of West Antarctica than is being lost as glaciers across Antarctica thin out. More snow accumulation is, counterintuitively, a sign of global warming; more precipitation happens when there is more moisture in the air, and more moisture in the air is a product of higher temperatures, said Elizabeth Thomas, a glaciologist with the British Antarctic Survey.
Skeptic arguments that Antarctica is gaining ice frequently hinge on an error of omission, namely ignoring the difference between land ice and sea ice.
In glaciology and particularly with respect to Antarctic ice, not all things are created equal. Let us consider the following differences. Antarctic land ice is the ice which has accumulated over thousands of years on the Antarctica landmass itself through snowfall. This land ice therefore is actually stored ocean water that once fell as precipitation. Sea ice in Antarctica is quite different as it is ice which forms in salt water primarily during the winter months. When land ice melts and flows into the oceans global sea levels rise on average; when sea ice melts sea levels do not change measurably.
BONUS
NASA vil ha stålkontroll på isen i fremtiden. Ny laserteknologi er på plass:
ICESat-2 will estimate the annual change in the height of the Antarctic and Greenland ice sheets to within 4 mm – the width of a No. 2 pencil. This accuracy is critical to the mission's primary goal: providing the most accurate information possible about our planet's ice sheets, glaciers and sea ice, how they are changing, and what this change means for all of us. Once launched next year, ICESat-2's laser instrument, ATLAS, will take 1,387 different paths over Earth each season, creating a dense grid of data – especially over the poles. Since each orbit repeats every 91 days, scientists will be able to track how the ice changes between the seasons.
MYTE #9 ISBJØRN-BESTANDEN ER ØKENDE
Isbjørnbestanden er ikke så relevant enn så lenge og har, i motsetning til hva fornektere vil ha deg til å tro, aldri vært frontet som bevis for global oppvarming. Vi vet for lite om de fleste av bestandene.
Although the study results seemingly reflect the roughly 40 percent decline in polar bear populations seen in this part of the Arctic, the study was not broad enough to draw large conclusions. But the new information on how dwindling sea ice affects the health of female polar bears could be important for conservation efforts.“No sea ice, no polar bears, it’s really simple,” said Dr. Bechshoft.
There’s a myth that polar bear populations are thriving because they’ve grown since the 1970s. That growth has nothing to do with the climate – it was due to the introduction of the International Agreement on the Conservation of Polar Bears in 1973, which restricted and in some circumstances banned the hunting of polar bears, which had caused their populations to dwindle. Global warming – specifically the rapid decline in the Arctic sea ice they need to hunt – has caused polar bear populations to decline in recent years.
Because the global population estimate range includes subpopulation estimates of variable quality it is not used as a monitoring benchmark or other status assessment tool. Rather, it simply expresses a reasonable range in numbers, based on a combination of the best available information and understandings of polar bear habitat. Conservation assessments focus on the trends in subpopulations for which statistical estimates are available. Some of those subpopulations are declining, others are stable, and some may be increasing.

Isbjørnen er klassifisert som en sårbar art. La oss sjekke status:
Last updated 2017 with data from the IUCN Polar Bear Specialists Group
The situation is serious for them, being on the red list of threatened species. (Vulnerable).
Proceedings from PBSG 18 is published!
Proceedings from PBSG 18 is published!
Of the 19 polar bear subpopulations recognized by the PBSG, estimates of population size were available for 14. Of the 19 subpopulations,
5 appeared to be stable,
1 may be increasing,
2 were decreasing,
and
11 had insufficient data to estimate a trend.
However, information derived from field studies of polar bears and analyses of remotely-collected environmental data help fill gaps in our understanding of how they are responding to a changing Arctic. Since satellite imagery of sea ice extent began in 1978, the summertime extent of sea ice has declined from 2.3–20.5 % per decade, depending on the subpopulation. Empirical data collected from field efforts is revealing the mechanisms that climate warming driven sea ice loss is having on polar bears. The nature and timing of these mechanisms is not uniform across their pan-Arctic range.
Neighboring subpopulations experiencing similar sea ice declines have responded differently, likely due to
regional variation in productivity of the underlying biological oceanography, the energetic costs for occupying drifting sea ice, and sub-optimal habitats. Regardless, unabated sea ice declines as projected through the 21st century, are expected to negatively impact all polar bear subpopulations over the long-term. “
regional variation in productivity of the underlying biological oceanography, the energetic costs for occupying drifting sea ice, and sub-optimal habitats. Regardless, unabated sea ice declines as projected through the 21st century, are expected to negatively impact all polar bear subpopulations over the long-term. “
Here are ca 20 studies confirming CC and decreasing sea ice as their major threats: Arctic sea ice loss has thus far progressed faster than most climate models have predicted [...] Arctic sea ice extent is linearly related to global mean temperature, which in turn, is directly related to atmospheric greenhouse gas concentrations (Amstrup et al. 2010). Population and habitat models predict substantial declines in the distribution and abundance of Polar Bears in the future.
Anthropogenic and natural changes in Arctic environments, as well as recognition of the shortcomings of our knowledge of Polar Bear ecology, are increasing the challenges for Polar Bear conservation and management. Higher ambient temperatures and erratic weather fluctuations, symptoms of anthropogenic climate change, are increasing across the range of polar bears. Polar Bears are dependent upon Arctic sea ice for access to their prey. Their dependence on an ephemeral habitat that exists as a function of sea surface and atmospheric temperatures means that climate warming poses the single most important threat to the long-term persistence of Polar Bears (Obbard et al. 2010). Arctic sea ice loss has thus far progressed faster than most climate models have predicted (Stroeve et al. 2007) with September sea extent declining at a linear rate of 14% per decade from 1979 through 2011 (Stroeve et al. 2012, Stroeve et al. 2014). Because changes in sea-ice are known to alter Polar Bear abundance, productivity, body condition, and distribution (Stirling et al. 1999, Fischbach et al. 2007, Schleibe et al. 2008, Durner et al. 2009, Regehr et al. 2010, Rode et al. 2010a, 2012, 2014b, Bromaghin et al. 2015), continued climate warming will increase future uncertainty and pose severe risks to the welfare of Polar Bear subpopulations (Stirling and Derocher 2012, Derocher et al. 2013). Arctic sea ice extent is linearly related to global mean temperature, which in turn, is directly related to atmospheric greenhouse gas concentrations (Amstrup et al. 2010). Population and habitat models predict substantial declines in the distribution and abundance of Polar Bears in the future (Durner et al. 2009, Amstrup et al. 2008, Hunter et al. 2010, Castro de la Guardia et al. 2013, Hamilton et al. 2014)
Anthropogenic and natural changes in Arctic environments, as well as recognition of the shortcomings of our knowledge of Polar Bear ecology, are increasing the challenges for Polar Bear conservation and management. Higher ambient temperatures and erratic weather fluctuations, symptoms of anthropogenic climate change, are increasing across the range of polar bears. Polar Bears are dependent upon Arctic sea ice for access to their prey. Their dependence on an ephemeral habitat that exists as a function of sea surface and atmospheric temperatures means that climate warming poses the single most important threat to the long-term persistence of Polar Bears (Obbard et al. 2010). Arctic sea ice loss has thus far progressed faster than most climate models have predicted (Stroeve et al. 2007) with September sea extent declining at a linear rate of 14% per decade from 1979 through 2011 (Stroeve et al. 2012, Stroeve et al. 2014). Because changes in sea-ice are known to alter Polar Bear abundance, productivity, body condition, and distribution (Stirling et al. 1999, Fischbach et al. 2007, Schleibe et al. 2008, Durner et al. 2009, Regehr et al. 2010, Rode et al. 2010a, 2012, 2014b, Bromaghin et al. 2015), continued climate warming will increase future uncertainty and pose severe risks to the welfare of Polar Bear subpopulations (Stirling and Derocher 2012, Derocher et al. 2013). Arctic sea ice extent is linearly related to global mean temperature, which in turn, is directly related to atmospheric greenhouse gas concentrations (Amstrup et al. 2010). Population and habitat models predict substantial declines in the distribution and abundance of Polar Bears in the future (Durner et al. 2009, Amstrup et al. 2008, Hunter et al. 2010, Castro de la Guardia et al. 2013, Hamilton et al. 2014)
There are 19 subpopulations of polar bears spread throughout the Arctic, and while some are doing alright, others have already begun to feel the effects of climate change.
Among them is the population around the western shore of Hudson Bay, and the town of Churchill Manitoba.The evidence is clear that there has been great change in the climate, and the bear population is showing it.
Biologist Nick Lunn has been studying the bears for some 30 years. He says the population is on a long,slow, steady decline. From some 1200 bears in the late 1980’s he says there are only about 800 now.Mer.
Biologist Nick Lunn has been studying the bears for some 30 years. He says the population is on a long,slow, steady decline. From some 1200 bears in the late 1980’s he says there are only about 800 now.Mer.
In the future
Some populations are still hunted quite heavily, and their status is uncertain. By 2040, scientists predict that only a fringe of ice will remain in Northeast Canada and Northern Greenland when all other large areas of summer ice are gone. This "Last Ice Area" is likely to become important for polar bears and other life that depends on ice. A projection of sea ice in the archipelago, supported by WWF, shows that much of the region is facing significant ice loss in the coming decades - with potentially serious consequences for polar bears.
Global polar bear numbers are projected to decline by 30% by 2050.

Abstract
Background
Sea ice across the Arctic is declining and altering physical characteristics of marine ecosystems. Polar bears (Ursus maritimus) have been identified as vulnerable to changes in sea ice conditions. We use sea ice projections for the Canadian Arctic Archipelago from 2006 – 2100 to gain insight into the conservation challenges for polar bears with respect to habitat loss using metrics developed from polar bear energetics modeling.
Principal Findings
Shifts away from multiyear ice to annual ice cover throughout the region, as well as lengthening ice-free periods, may become critical for polar bears before the end of the 21st century with projected warming. Each polar bear population in the Archipelago may undergo 2–5 months of ice-free conditions, where no such conditions exist presently. We identify spatially and temporally explicit ice-free periods that extend beyond what polar bears require for nutritional and reproductive demands.
Conclusions/Significance
Under business-as-usual climate projections, polar bears may face starvation and reproductive failure across the entire Archipelago by the year 2100.
Climate change discussions on social media are very influential. A new study in BioScience shows that when it comes to iconic topics such as polar bears and retreating sea ice, climate blogs fall into two distinct camps with little or no overlap between deniers and the available scientific facts. The study's first author, NIOO-KNAW researcher Jeff Harvey says, "It's time for scientists to counter the misinformation and engage directly with the public far more."
Polar bears and retreating sea ice have become iconic symbols of the polarised climate change debate. By focusing on these subjects, deniers of human-caused global warming cast doubt among the public about the entire body of climate change knowledge. But a new study of the underlying science used in the debatecould well melt down the trustworthiness of these deniers on social media.
BONUS:
Deniers crank:
Susan Crockford writes a lot about polar bears, but does so mostly on her own website and for anti-mitigation thinktanks such as the Heartland Institute and the Global Warming Policy Foundation (GWPF); not in the scientific literature.
The researchers also singled out Polar Bear Science, a blog run by Susan J. Crockford, a Canadian zoologist, as a primary source of dubious information about the status of polar bears. About 80 percent of the contrarian websites that the researchers studied referred to Dr. Crockford’s blog as a primary source, they said.
Internet Blogs, Polar Bears, and Climate-Change Denial by Proxy | BioScience | Oxford Academic

MYTE #10 VITENSKAPEN ER IKKE AVGJORT OM KLIMA
Bare når vi inkluderer menneskers innflytelse på klima ser vi at ALLE brikkene faller på plass:

Anthropogenic climate change (ACC)/anthropogenic global warming (AGW) is not a hypothesis. It is a robust theory, referred to as "settled fact" by scientists.
Per the National Academies of Science, science advisors to Congress and the Office of the Presidency since Lincoln, in their 2010 publication Advancing The Science Of Climate Change (p. 22):
"Some scientific conclusions or theories have been so thoroughly examined and tested, and supported by so many independent observations and results, that their likelihood of subsequently being found to be wrong is vanishingly small.
Such conclusions and theories are then regarded as settled facts.
This is the case for the conclusions that the Earth system is warming and that much of this warming is very likely due to human activities."
Global climate models clearly show the effect of human-induced changes on global temperatures. The blue band shows how global temperatures would have changed due to natural forces only (without human influence). The pink band shows model projections of the effects of human and natural forces combined. The black line shows actual observed global average temperatures. The close match between the black line and the pink band indicates that observed warming over the last half-century cannot be explained by natural factors alone, and is instead caused primarily by human factors.
MYTE #11
Some aspects of the science of AGW are known with near 100% certainty. The greenhouse effect itself is as established a phenomenon as any: it was discovered in the 1820s and the basic physics was essentially understood by the 1950s. There is no reasonable doubt that the global climate is warming. And there is also a clear trail of evidence leading to the conclusion that it’s caused by our greenhouse gas emissions. Some aspects are less certain; for example, the net effect of aerosol pollution is known to be negative, but the exact value needs to be better constrained.
Anthropogenic climate change (ACC)/anthropogenic global warming (AGW) is not a hypothesis. It is a robust theory, referred to as "settled fact" by scientists.
Per the National Academies of Science, science advisors to Congress and the Office of the Presidency since Lincoln, in their 2010 publication Advancing The Science Of Climate Change (p. 22):
"Some scientific conclusions or theories have been so thoroughly examined and tested, and supported by so many independent observations and results, that their likelihood of subsequently being found to be wrong is vanishingly small.
Such conclusions and theories are then regarded as settled facts.
This is the case for the conclusions that the Earth system is warming and that much of this warming is very likely due to human activities."
Global climate models clearly show the effect of human-induced changes on global temperatures. The blue band shows how global temperatures would have changed due to natural forces only (without human influence). The pink band shows model projections of the effects of human and natural forces combined. The black line shows actual observed global average temperatures. The close match between the black line and the pink band indicates that observed warming over the last half-century cannot be explained by natural factors alone, and is instead caused primarily by human factors.
MYTE #11
DET VAR VARMERE I MIDDELALDEREN
VIKINGENE OG GRØNLAND/LOKAL OPPVARMING VS GLOBAL OPPVARMING
THE MEDIEVAL WARM PERIOD
At en skogbrann er forårsaket av lynnedslag betyr ikke at et leirbål ikke kan forårsake en skogbrann og.Tidligere (regionale) varmeperioder beviser ikke at den oppvarmingen vi ser nå ikke er menneskeskapt. Dette er en irrelevant konklusjon-tankefeil.
Ofte hører en klimatåkeleggerne si ting som at det var varmere før og gresset var grønnere på Grønland for 1000 år siden.” Ja, deler av nordområdene hadde "høy" temperatur under Vikingtiden, men Jorden som helhet var ikke spesielt varm for tusen år siden.
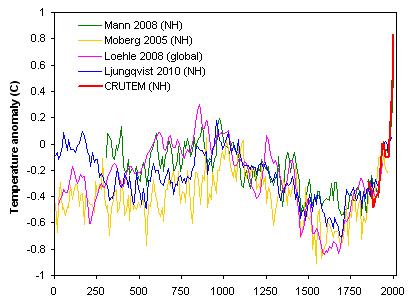
Og, selv om Antarktis skulle bli kjøligere, betyr ikke det at kloden som helhet ikke blir varmere. Klimamodeller forutsier ikke nødvendigvis en jevn oppvarming av hele planeten. Endringer i vindmønstre og havstrømmer vil endre måten varmen fordeles, noe som fører til at noen steder varmes mye raskere enn gjennomsnittet, mens noen få vil kjøles, i hvert fall i begynnelsen..Noen har funnet en oase i Sahara....DERFOR kan ikke Sahara være en ørken.
“Selvsagt er naturlig forekommende variasjoner viktig, men det finnes ingen naturlige variasjoner som – på én og samme tid – kan øke global atmosfære- og havtemperatur." Uansett hva som skjedde før, er det nå som betyr noe. Tenk deg at det var en middelalder varmeperiode som var global og så varm som i dag. Først må den ha hatt en annen årsak enn økt drivhuseffekt, og for det andre, sluttet den. Naturlig variasjon. Skeptikerne ser ofte dette som et argument mot "CO2-hypotesen", siden de tror de har funnet "noe annet" som kan forårsake det vi ser nå, men det er en grundig logisk tankefeil. Klimaendringene vi ser nå pga økt mengde av klimagasser, spesielt av C02, har vi fra grunnleggende fysikk, ikke fra målinger av en temperatur som har vært relativt stabil i tusenvis av år. Vi vet at effekt / oppvarming er her - og vi vet at det ikke vil forandre seg i nærmere fremtid. Diskusjonen om middelalderen er akademisk interessant, men ellers en blindgate.
No matter what happened before, it's NOW that matters. Imagine if it was a medieval warming period that was global and as hot as today. First, it must have had a different reason than increased greenhouse effect, and secondly, it ended. Thus: it was Natural variability. The skeptics often see this as an argument against the "CO2 hypothesis", since they think they have found "something else" that can cause what we see now, but it is a thorough logical shortcoming. The climate effect of increased amount of greenhouse gases, we have from basic physics, not from measurements of a temperature thats been relatively stable for thousands of years. We know that effect/warming is here - and we know it's not to change soon. The discussion about the Middle Ages is academically interesting, but otherwise a blind alley. (And for the record: There is still no research showing a global warming period in the Middle Ages. Local, yes, and short, but not a long, global one comparable to today.
Sammenlign temperatur-kartet fra 1000 år tilbake - med sine hot spots, med dagens (2016) varmekart.

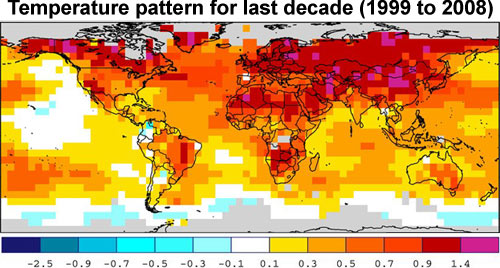
YouTube-brukeren potholer54 bruker oppdatert vitenskap fra klimaforskere til å debunke denne myten:
While the Medieval Warm Period saw unusually warm temperatures in some regions, globally the planet was cooler than current conditions.
What is clear, both from the temperature reconstructions and from independent evidence – such as the extent of the recent melting of mountain glaciers – is that the planet has been warmer in the past few decades than at any time during the medieval period. In fact, the world may not have been so warm for 6000 or even 125,000 years. Andes-isbreene som har vært intakt i mer enn 5000 år, smelter nå raskt (se originalstudie, nyhetsdekning). Hvis den middelalderske varme-perioden virkelig var global, ville disse isbreene ikke ha overlevd.
"The Medieval Warm Period was certainly not a global event and probably didn't even span the entire North Atlantic region," said Nicolás Young, a glacial geologist at Columbia University who was the lead author of the study.
Young and colleagues measured the extent of glaciers, a proxy for temperature, over the last 1,000 years in Western Greenland and further west on Baffin Island. They found that glacial coverage from 950 to 1250, the years of the purported Medieval Warm Period, was only slightly less than during a subsequent cold period known as the Little Ice Age.
"These glaciers were almost just as big during the Medieval Warm Period as they were during the Little Ice Age in the Baffin Bay and Labrador Sea region," Young said. "It probably wasn't all that warm during the Medieval Warm Period."
"If anyone is interested in the actual evidence this is going to be one more nail in the coffin of the Medieval Warm Period," said Gifford Miller, a paleo climatologist at the University of Colorado. It shows "the ice is in an expanded state and it's not retreating rapidly, it certainly says that Medieval times were not anomalously warm."
http://advances.sciencemag.org/content/1/11/e1500806
BONUS
VIKINGENE
All nyere forskning peker nå bort i fra at vikingene ble møtt av et "varmere" klima på Grønland: Mer om vikingene og Grønland her.
The strong implication: it was at least as cold when the Vikings arrived as when they left. “If the Vikings traveled to Greenland when it was cool, it’s a stretch to say deteriorating climate drove them out,” said Young. The findings fit with other recently developed evidence that the effects of the Medieval Warm Period were not uniform; some places, including parts of central Eurasia and northwestern North America, may actually have cooled off.
Study Undercuts Idea That 'Medieval Warm Period' Was Global.
Vikings May Not Have Colonized Greenland in Nice Weather. "Furthermore, a relatively cool western North Atlantic region during the MWP has implications for understanding Norse migration patterns during the MWP. Our results, paired with other regional climate records, point to nonclimatic factors as contributing to the Norse exodus from the western North Atlantic region."
The Vikings did farm, but they farmed in two settlements in limited coastal fringes, and it was worse-than-subsistence farming (because the farming and building eroded the fragile top-soil). The same sort of farming seems to have been possible for much of the intervening time, therefore the farming cannot be taken as direct evidence of warmer conditions. The Vikings did so well at farming that they died doing it while the local Inuits still thrive today.
The Viking settlements did not get buried under glaciers (Google Hvalsey Church). One got buried under wind-blown sand. Thus the failure of the settlements cannot be taken as direct evidence of cooler conditions. The portions of Greenland not immediately adjacent to the ocean have been continuously covered in ice sheets for tens of thousands to hundreds of thousands to millions of years.
See Citation 1.
If you want further proof and readings about what the Viking settlements failed, read Jared Diamond's "Collapse". Diamond refers to several book-length accounts, but a shorter older account is Magnus Magnusson's "Vikings" (1980).
Evidence exists of an ice sheet of at least some extent in a Greenland for at least 2.7 million years.
"Greenland really was green! However, it was millions of years ago," said Rood. "Before it was covered by the second largest body of ice on Earth, Greenland looked like the green Alaskan tundra."
What is clear, however, from an abundance of worldwide indicators, is that global temperatures are on a path to be "far warmer than the warmest interglacials in millions of years," said Bierman. "There is a 2.7-million-year-old soil sitting under Greenland. The ice sheet on top of it has not disappeared in the time in which humans became a species. But if we keep on our current trajectory, the ice sheet will not survive. And once you clear it off, it’s really hard to put it back on."
See Citation 2.
Recent research confirms that the Vikings’ mysterious abandonment of Greenland was not due to climate change:
See Citation 3.
"the Greenland Norse were "not a civilization stuck in their ways." To NABO archaeologist George Hambrecht of the University of Maryland in College Park, "The new story is that they adapted but they failed anyway.""
And
"Despite the signs of crisis at a few Western Settlement sites, those in the Eastern Settlement show no sign of a violent end. Instead, after farmhouses collapsed, remaining settlers scavenged the wood from them, suggesting a slow dwindling of population. The challenge for the average Greenlander to survive drove "a constant emigration" back to Iceland and Europe, Fitzhugh hypothesizes, "which could bring the Eastern [Settlement] to a close peacefully, without starvation or death by Inuit.""
See Citation 4.
“Let me … assure you that the last wine plants to grow in Greenland were those that grew …60 million years ago.”
See Citation 5.
Citation List:
1. www.skepticalscience.com/greenland-used-to-be-green.htm
www.skepticalscience.com/10000-years-warmer.htm
www.cfa.harvard.edu/~wsoon/DanBotkin08-d/MorosAndrewsetal06-DriftIceHolocene.pdf
2. www.nasa.gov/content/goddard/researchers-find-3-million-year-old-landscape-beneath-greenland-ice-sheet/index.html
3. www.washingtonpost.com/news/energy-environment/wp/2015/12/04/climate-change-may-not-have-driven-the-vikings-from-greenland-after-all/
4. www.sciencemag.org/news/2016/11/why-did-greenland-s-vikings-disappear?
5. www.sanluisobispo.com/news/weather/weather-watch/article39516393.html
MYTE #12
"HOCKEY-KØLLEN" ER MOTBEVIST
I 1998 publiserte Michael E. Mann, Raymond S. Bradley og Malcolm K. Hughes (i fellesskap gjerne kalt MBH) artikkelen «Global-scale temperature patterns and climate forcing over the past six centuries» i Nature. Her viser de en rekonstruksjon av temperaturen på den nordlige halvkula fra 1400. Ei grafisk framstilling av resultatene viser ei svært stor økning i temperaturen i siste halvdel av 1900-tallet, mens det i perioden før dette var mindre variasjoner. Grafen har dermed form som ei liggende ishockeykølle, og den fikk snart tilnavnet hockeykøllegrafen. Året etter publiserte de tre en utvidelse av grafen, som gikk tilbake til år 1000. MBHs hovedfunn er i stor grad bekrefta av seinere forskning.
Allerede i 2006 ble "kølla" godkjent av selveste The National Academy of Science. Now the US National Academy of Sciences (NAS) has weighed in with a report on the ‘hockey-stick’ plot, which it hopes will finally lay the "controversy" to rest.
Since the hockey stick paper in 1998, there have been a number of proxy studies analysing a variety of different sources including corals, stalagmites, tree rings, boreholes and ice cores. They all confirm the original hockey stick conclusion: the 20th century is the warmest in the last 1000 years and that warming was most dramatic after 1920.

Det finnes haugevis med studier som bekrefter hockeykøllen. De tre mest omfattende studiene noensinne gjort på temaet:
Most Comprehensive Paleoclimate Reconstruction Confirms Hockey Stick.
78 researchers from 24 countries, together with many other colleagues, worked for seven years in the PAGES 2k project on the new climate reconstruction. “2k” stands for the last 2000 years, while PAGES stands for the Past Global Changes program launched in 1991. Recently, their new study was published in Nature Geoscience. It is based on 511 climate archives from around the world, from sediments, ice cores, tree rings, corals, stalagmites, pollen or historical documents and measurements. All data are freely available.
Planet Earth is warmer than it has been for at least 2,000 years, according to a study that took its temperature from 692 different “natural thermometers” on every continent and ocean on the planet. The database gathers 692 records from 648 locations, including all continental regions and major ocean basins. The records are from trees, ice, sediment, corals, speleothems, documentary evidence, and other archives. They range in length from 50 to 2000 years, with a median of 547 years, while temporal resolution ranges from biweekly to centennial.
A Reconstruction of Regional and Global Temperature for the Past 11,300 Years
Surface temperature reconstructions of the past 1500 years suggest that recent warming is unprecedented in that time. Here we provide a broader perspective by reconstructing regional and global temperature anomalies for the past 11,300 years from 73 globally distributed records. Early Holocene (10,000 to 5000 years ago) warmth is followed by ~0.7°C cooling through the middle to late Holocene (<5000 years ago), culminating in the coolest temperatures of the Holocene during the Little Ice Age, about 200 years ago. This cooling is largely associated with ~2°C change in the North Atlantic. Current global temperatures of the past decade have not yet exceeded peak interglacial values but are warmer than during ~75% of the Holocene temperature history. Intergovernmental Panel on Climate Change model projections for 2100 exceed the full distribution of Holocene temperature under all plausible greenhouse gas emission scenarios.Although each of the temperature reconstructions are different (due to differing calibration methods and data used), they all show some similar patterns of temperature change over the last several centuries.
Most striking is the fact that each record reveals that the 20th century is the warmest of the entire record, and that warming was most dramatic after 1920.
An independent assessment of Mann's hockey stick was conducted by the National Center for Atmospheric Research (Wahl 2007). They reconstructed temperatures employing a variety of statistical techniques (with and without principal components analysis). Their results found slightly different temperatures in the early 15th Century. However, they confirmed the principal results of the original hockey stick - that the warming trend and temperatures over the last few decades are unprecedented over at least the last 600 years.RealClimate oppklarer de fire største mytene her.
The Hockey Stick: The Most Controversial Chart in Science, Explained
Climate deniers threw all their might at disproving the famous climate change graph. Here's why they failed.
Allerede i 2006 ble "kølla" godkjent av selveste The National Academy of Science. Now the US National Academy of Sciences (NAS) has weighed in with a report on the ‘hockey-stick’ plot, which it hopes will finally lay the "controversy" to rest.
Since the hockey stick paper in 1998, there have been a number of proxy studies analysing a variety of different sources including corals, stalagmites, tree rings, boreholes and ice cores. They all confirm the original hockey stick conclusion: the 20th century is the warmest in the last 1000 years and that warming was most dramatic after 1920.

Det finnes haugevis med studier som bekrefter hockeykøllen. De tre mest omfattende studiene noensinne gjort på temaet:
Most Comprehensive Paleoclimate Reconstruction Confirms Hockey Stick.
78 researchers from 24 countries, together with many other colleagues, worked for seven years in the PAGES 2k project on the new climate reconstruction. “2k” stands for the last 2000 years, while PAGES stands for the Past Global Changes program launched in 1991. Recently, their new study was published in Nature Geoscience. It is based on 511 climate archives from around the world, from sediments, ice cores, tree rings, corals, stalagmites, pollen or historical documents and measurements. All data are freely available.
Planet Earth is warmer than it has been for at least 2,000 years, according to a study that took its temperature from 692 different “natural thermometers” on every continent and ocean on the planet. The database gathers 692 records from 648 locations, including all continental regions and major ocean basins. The records are from trees, ice, sediment, corals, speleothems, documentary evidence, and other archives. They range in length from 50 to 2000 years, with a median of 547 years, while temporal resolution ranges from biweekly to centennial.
A Reconstruction of Regional and Global Temperature for the Past 11,300 Years
Surface temperature reconstructions of the past 1500 years suggest that recent warming is unprecedented in that time. Here we provide a broader perspective by reconstructing regional and global temperature anomalies for the past 11,300 years from 73 globally distributed records. Early Holocene (10,000 to 5000 years ago) warmth is followed by ~0.7°C cooling through the middle to late Holocene (<5000 years ago), culminating in the coolest temperatures of the Holocene during the Little Ice Age, about 200 years ago. This cooling is largely associated with ~2°C change in the North Atlantic. Current global temperatures of the past decade have not yet exceeded peak interglacial values but are warmer than during ~75% of the Holocene temperature history. Intergovernmental Panel on Climate Change model projections for 2100 exceed the full distribution of Holocene temperature under all plausible greenhouse gas emission scenarios.Although each of the temperature reconstructions are different (due to differing calibration methods and data used), they all show some similar patterns of temperature change over the last several centuries.
Most striking is the fact that each record reveals that the 20th century is the warmest of the entire record, and that warming was most dramatic after 1920.
An independent assessment of Mann's hockey stick was conducted by the National Center for Atmospheric Research (Wahl 2007). They reconstructed temperatures employing a variety of statistical techniques (with and without principal components analysis). Their results found slightly different temperatures in the early 15th Century. However, they confirmed the principal results of the original hockey stick - that the warming trend and temperatures over the last few decades are unprecedented over at least the last 600 years.RealClimate oppklarer de fire største mytene her.
Michael Mann Did Not Sabotage His Law Suit, But Deniers Are Sabotaging The Planet.
Fordi Michael Manns hockey-kølle så til de grader visualiserte global oppvarming, har både den og Michael Mann vært under et "evig" angrep fra klimafornekterne. I denne videoen oppklarer Mann selv alle mytene om "kølla":
Climate deniers threw all their might at disproving the famous climate change graph. Here's why they failed.
MYTE #13
OZONLAGET
Multiple satellite measurements and ground-based observations have determined the ozone layer has stopped declining since 1995 while temperature trends continue upwards. Are the ozone hole and global warming related?

The ozone hole and global warming are not the same thing, and neither is the main cause of the other.The ozone hole is an area in the stratosphere above Antarctica where chlorine and bromine gases from human-produced chlorofluorocarbons (CFCs) and halons have destroyed ozone molecules.
Global warming is the rise in average global surface temperature caused primarily by the build-up of human-produced greenhouses gases, mostly carbon dioxide and methane, which trap heat in the lower levels of the atmosphere. Full oversikt for ozon-nerder finner du fra NASA her.
Siste: The Ozone Hole Is Slowly Healing - But This Chemical Could Delay Its Recovery by Decades "a common industrial chemical called dichloromethane - which has the power to destroy ozone - has doubled in the atmosphere over the last 10 years. And if its concentrations keep growing, scientists say, it could delay the Antarctic ozone layer's return to normal by up to 30 years."
MYTE #14 SKYENE STYRER TEMPERATUREN
Climate deniers have come up with a lot of arguments about why we shouldn’t worry about global warming – about 200 of them – but most are quite poor, contradictory, and easily debunked by consulting the peer-reviewed scientific literature. The cleverest climate contrarians settle on the least implausible argument – that equilibrium climate sensitivity (ECS – how much a doubling of the amount of carbon dioxide in the atmosphere will increase Earth’s surface temperature) is low, meaning that the planet will warm relatively slowly in response to human carbon pollution.
But they have to explain how that can be the case, because there are a lot of factors that amplify global warming. For example, a warmer atmosphere holds more water vapor, which is itself a greenhouse gas, adding further warming. Warming also melts ice, leaving Earth’s surface less reflective, absorbing more sunlight. There are a number of these amplifying ‘feedbacks,’ but few that would act to significantly slow global warming.
Clouds are one possible exception, because they both act to amplify global warming (being made of water vapor) and dampen it (being white and reflective). Which effect wins out depends on the type of cloud, and so whether clouds act to accelerate or slow global warming depends on exactly how the formation of different types of clouds changes in a hotter world. That’s hard to predict, so many contrarians have wishfully argued that clouds will essentially act as a thermostat to control global warming.
Clouds study finds that low climate sensitivity is ‘extremely unlikely’ - Carbon Brief

The effect of clouds in a warming world is complicated. One challenge is that clouds cause both warming and cooling. Low-level clouds tend to cool by reflecting sunlight. High-level clouds tend to warm by trapping heat.
For skynerder: The Impact of Global Warming on Marine Boundary Layer Clouds over the Eastern Pacific—A Regional Model Study
According to the Intergovernmental Panel on Climate Change, the Earth’s mean temperature is predicted to rise by between 1.5 – 4.5 °C for a doubling of carbon dioxide in the atmosphere, which is expected by around 2050. One of the main reasons for this large uncertainty, which makes it difficult for society to know how best to act against climate change, is a poor understanding of aerosol particles in the atmosphere and their effects on clouds.
To date, all global climate models use relatively simple parameterisations for aerosol production that are not based on experimental data. Now, data collected by CLOUD have been used to build a model of aerosol production based solely on laboratory measurements. This more robust understanding of the nucleation process that gives rise to aerosols has allowed researchers to establish the main causes of new particle formation throughout the troposphere, and could narrow the variation in projected global temperature rise.
“This marks a big step forward in the reliability and realism of how models describe aerosols and clouds,” says CLOUD spokesperson Jasper Kirkby. “It’s addressing the largest source of uncertainty in current climate models and building it on a firm experimental foundation of the fundamental processes.”
MYTE #15
MÅLESTASJONENE BLIR PÅVIRKET AV OMGIVELSENE /NOAA/NASA tukler med dataene
Compo et al (2013) confirmed global surface air warming without using the instrumental surface temperature record, meaning the warming is real, not just confounding factors like UHI.
https://agupubs.onlinelibrary.wiley.com/doi/full/10.1002/jgrd.50296
If you need a more common sense dismissal of the urban bias "zombie theory,"
simply look at the regions of the planet experiencing the most rapid growth: regions of the Arctic (see graphic below).
The last time I checked, there are not many large cities to bias results there. Like the USHCN,
there is also a Global Historical Climate Network (GHCN), which according to NOAA's website:
there is also a Global Historical Climate Network (GHCN), which according to NOAA's website:
"The simple take-away is that while UHI and other urban-correlated biases are real (and can have a big effect), current methods of detecting and correcting localized breakpoints are generally effective in removing that bias. Blog claims that UHI explains any substantial fraction of the recent warming in the US are just not supported by the data."

https://www.theguardian.com/science/2012/jul/29/climate-change-sceptics-change-mind
https://www.forbes.com/sites/alexknapp/2011/10/24/independent-study-confirms-that-global-warming-exists/#6ebe922662f8

http://www.realclimate.org/index.php/archives/2011/07/revisiting-historical-ocean-surface-temperatures/


UAH SATELLITE DATA:
http://www.drroyspencer.com/latest-global-temperatures/

UAH data transfered to 12 month periods, not 13:

Ask yourself this question...
Do you think that NASA,
who can send a space probe, Juno, on a 5 year journey through the solar system and have it enter its orbit around Jupiter 1 second of schedule,
cant work around the UHI-effect and get accurate temperature data for the Earth?
Well guess what..NASA dont use raw data.NASA GISS corrects for urban heat islands.
A recent flurry of activity on social media last week centered around a new study published in the Journal of Applied Meteorology and Climatology. According to the abstract, it found that "temperature observations (in an experiment with four observation sites) were warmest for the site closest to the built environment." This finding is not "News." We have known about the Urban Heat Island (UHI) effect for many decades, and I have previously described it in Forbes.
I suppose the novel caution in this new paper is that urban "creep" is possible at some temperature stations used for overall climate change assessment like the U.S. Climate Reference Network. My colleague Dr. Roger Pielke Sr. has a deep body of work on land changes and climate impacts so I suspect he is very pleased to see studies like this as am I. However, this essay is written as an antidote to wild claims spouting the "cliche" or "zombie theory" that climate warming is caused by urban heat bias. Not only is that flawed, there is a greater danger that many have overlooked.
Quantifying the effect of urbanization on U.S. Historical Climatology Network temperature records
Finally, an evaluation of the homogenization of USHCN temperature series using subsets of rural-only and urban-only reference series from the larger U.S. Cooperative Observer (Coop) Network suggests that the composition of Coop stations surrounding USHCN stations is sufficiently “rural” to limit the aliasing of urban heat island signals onto USHCN version 2 temperature trends during homogenization.
While urban areas are undoubtedly warmer than surrounding rural areas, this has had little to no impact on warming trends.
The warming trend is the same in rural and urban areas, measured by thermometers and satellites, and by natural thermometers.
"Time series of the Earth’s average land temperature are estimated using the Berkeley Earth methodology applied to the full dataset and the rural subset; the difference of these is consistent with no urban heating effect over the period 1950 to 2010"
"The Urban Heat Island effect is real. Berkeley’s analysis focused on the question of whether this effect biases the global land average. Our UHI paper analyzing this indicates that the urban heat island effect on our global estimate of land temperatures is indistinguishable from zero."
From the Berkeley Earth page:
Berkeley Earth has examined 16 million monthly average temperature observations from 43,000 weather stations...The weather station data is combined with sea surface temperature data from the UK Met Office’s Hadley Centre (HadSST). This ocean data is based on 355 million measurements collected by ships and buoys, including 12 million observations obtained in 2017.
"The effect of urban heating on estimates of global average land surface temperature is studied by applying an urban-rural classification based on MODIS satellite data to the Berkeley Earth temperature dataset compilation of 36,869 sites from 15 different publicly available sources. We compare the distribution of linear temperature trends for these sites to the distribution for a rural subset of 15,594 sites chosen to be distant from all MODISidentified urban areas. While the trend distributions are broad, with one-third of the stations in the US and worldwide having a negative trend, both distributions show significant warming. Time series of the Earth’s average land temperature are estimated using the Berkeley Earth methodology applied to the full dataset and the rural subset; the difference of these is consistent with no urban heating effect over the period 1950 to 2010, with a slope of -0.10 ± 0.24/100yr (95% confidence)."
Even a Koch-brothers funded study confirmed the temperature data:
https://www.forbes.com/sites/alexknapp/2011/10/24/independent-study-confirms-that-global-warming-exists/#6ebe922662f8

Two long-term ocean-only temp series (with 95% conf. intervals) shows the same trend as weather stations and satellite data:
Isolated satellite data shows same trend as weather stations and ocean data:
RSS: This is from their home page:
http://images.remss.com/msu/msu_time_series.htmlhttp://www.drroyspencer.com/latest-global-temperatures/
UAH data transfered to 12 month periods, not 13:
http://blog.hotwhopper.com/2016/04/hottest-march-on-record-tracking-el.html

THE DATA COMBINED:
https://www.carbonbrief.org/explainer-how-surface-and-satellite-temperature-records-compare
A new study finds that NOAA temperature adjustments are doing exactly what they’re supposed to
In short, NOAA’s adjustments are doing what they’re supposed to do – removing biases in the raw data to make it more accurately reflect the true temperature changes at each measurement station. As lead author Zeke Hausfather told me,
"NOAA’s necessary corrections to biases in temperature data have come under a lot of poorly informed criticism in the past few months. Our new study as well as a great deal of prior research shows that adjustments to temperature stations are effective at removing biases introduced by station moves, instrument changes, and other factors. The fact that adjustments make the old historical network more similar to the new Climate Reference Network strongly suggests that they are getting it right."
Do you think that NASA,
who can send a space probe, Juno, on a 5 year journey through the solar system and have it enter its orbit around Jupiter 1 second of schedule,
cant work around the UHI-effect and get accurate temperature data for the Earth?
Well guess what..NASA dont use raw data.NASA GISS corrects for urban heat islands.
NASA GISS corrects for urban heat islands. This is the reason why we don't use raw data.
"All the adjustment procedures are well documented, programs, raw and adjusted data are publicly available, but deniers continue to imply either total incompetence or, far too often, outright fraud
In truth, adjustments exist to make the data better.
The real question is, how well is that process working?
To know that, Hausfather et al. (2016) compared station records before and after homogenization to a more reliable network of stations which don’t need adjustment.
The results were extremely encouraging, showing that the adjustment procedure for USHCN brought it much more closely into alignment with USCRN. This is strong evidence that the adjustments are doing exactly what they were intended to do: remove the influences that don’t really tell us about temperature change, so what remains really does tell us about temperature change, not irrelevant change....... But it does show, unambiguously, that critics of the entire adjustment process have absolutely no scientific basis for their complaints."
https://climatecrocks.com/2015/11/28/why-new-noaa-temps-are-more-reliable/
Denne videoen oppklarer også hvordan fornektere igjen prøver å undergrave klimaforskningen:
Latest:
I suppose the novel caution in this new paper is that urban "creep" is possible at some temperature stations used for overall climate change assessment like the U.S. Climate Reference Network. My colleague Dr. Roger Pielke Sr. has a deep body of work on land changes and climate impacts so I suspect he is very pleased to see studies like this as am I. However, this essay is written as an antidote to wild claims spouting the "cliche" or "zombie theory" that climate warming is caused by urban heat bias. Not only is that flawed, there is a greater danger that many have overlooked.
- Marshall Shepherd, Science, Forbes, May 6, 2019


MYTH# 17 THE MODELS ARE NOT ACCURATE
MYTH #18 THE OCEANS ARE OK
MYTE #19 HENRYS LOV/TERMODYNAMIKKENS ANDRE LOV MOTBEVISER DRIVHUSEFFEKTEN
MYTH #20 C02 IS "PLANTFOOD" AND A TRACE GASE
MYTE #21 AL GORE SAID...
MYTH #16 WHAT LAGS WHAT??
Spørsmålet bærer på et feilt premiss. Sannheten er litt av begge deler. Her oppklares dette: Ice core records tell us global warming causes the ocean to emit more CO2. More atmospheric CO2 in-turn traps more heat, making this is a reinforcing feedback loop. CO2 didn't initiate warming from past ice ages but it did amplify the warming.
In fact, about 90% of the global warming followed the CO2 increase.When the Earth comes out of an ice age, the warming is not initiated by CO2 but by changes in the Earth's orbit. The warming causes the oceans to release CO2. The CO2 amplifies the warming and mixes through the atmosphere, spreading warming throughout the planet. So CO2 causes warming AND rising temperature causes CO2rise. Overall, about 90% of the global warming occurs after the CO2 increase.
There are numerous feedback mechanisms involved in climate change. In other words, one event can trigger another event, which triggers another event, etc. In this case, what happened in the past was that a small amount of warming (usually regional) from factors other than CO2 (such as Milankovitch cycles) caused the oceans to warm up and release the CO2 stored in them (Martin et al. 2005; Toggweiler et al. 2006; Schmittner and Galbraith 2008; Skinner et al. 2010). Then, that increase in CO2 caused the majority of the warming (Shakun et al. 2012). So CO2 was actually the major driver of past climate changes (Lorius et al. 1990; Tripati et al. 2009; Shakun et al. 2012).
Shakun et al 2012 (above) found clear evidence of temperature lagging CO2 by obtaining data from a higher number and more diverse areas of the globe.
What does the lag of CO2 behind temperature in ice cores tell us about global warming?
This is an issue that is often misunderstood in the public sphere and media, so it is worth spending some time to explain it and clarify it. At least three careful ice core studies have shown that CO2 starts to rise about 800 years (600-1000 years) after Antarctic temperature during glacial terminations. These terminations are pronounced warming periods that mark the ends of the ice ages that happen every 100,000 years or so.
Does this prove that CO2 doesn’t cause global warming? The answer is no.
The reason has to do with the fact that the warmings take about 5000 years to be complete. The lag is only 800 years. All that the lag shows is that CO2 did not cause the first 800 years of warming, out of the 5000 year trend. The other 4200 years of warming could in fact have been caused by CO2, as far as we can tell from this ice core data.

Figure 3. Data from ice cores have been used to reconstruct Antarctic temperatures and atmospheric CO2
concentrations over the past 800,000 years. Temperature is based on
measurements of the isotopic content of water in the Dome C ice core. CO2 is measured in air trapped in ice, and is a composite of the Dome C and Vostok ice core. The current CO2
concentration (blue star) is from atmospheric measurements. The
cyclical pattern of temperature variations constitutes the ice age/
interglacial cycles. During these cycles, changes in CO2
concentrations (in blue) track closely with changes in temperature (in
red). As the record shows, the recent increase in atmospheric CO2
concentration is unprecedented in the past 800,000 years. Source:
Figure by Jeremy Shakun, data from Lüthi et al., 2008 and Jouzel et al., 2007.
Her ser vi bla a hvordan fornektere misbruker Vostok Ice Core dataene:
MYTH #18 THE OCEANS ARE OK
MYTE #19 HENRYS LOV/TERMODYNAMIKKENS ANDRE LOV MOTBEVISER DRIVHUSEFFEKTEN
MYTH #20 C02 IS "PLANTFOOD" AND A TRACE GASE
MYTE #21 AL GORE SAID...
MYTE #22 GLOBAL OPPVARMING STOPPET OPP I 1998
MYTE #23 METAN, KUFIS OG LANDBRUK
MYTE #24 KLIMAENDRINGENE ØKER IKKE KOSTNADENE MED EKSTREMVÆR
MYTE #25 KLIMAFORSKERNE ER "KJØPT OG BETALT"
MYTH #26 THEY CHANGED THE NAME FROM GLOBAL WARNING TO CLIMATE CHANGE
MYTH #27 WE'RE COMING OUT OF THE LITTLE ICE AGE AND WE'RE HEADING INTO A MINI ICE AGE (LOL)
MYTH #28 WIND TURBINES ARE THE BIRD KILLERS

Det er en del %-tall angående konsensus om AGW som flyter rundt. At konsensus er så overveldende og høy, er på grunn av alle bevisene; på etterprøvbar kunnskap og observasjoner ervervet gjennom den Vitenskapelige Metode. Og ikke minst pga hva grunnleggende fysikk og elementær kjemi forteller oss.
The consensus did not arise from a vote or a gathering. It speaks to the evidence. Scientists come to a consensus after a convergence of evidence leaves no significant doubt about a result. It happens a lot in science. There is a consensus that the speed of light is the universe's speed limit. Scientists didn't vote on that or gather to agree and find evidence to support that agreement. They came to a consensus after the research from multiple independent lines of evidence converged. The same process has taken place in climate science. Scientists didn't vote on the validity of AGW or come together and agree before the evidence came in. They came to a consensus based upon multiple independent lines of evidence converged to support AGW. The consensus among scientists is real, it is not based on popularity or voting, it is based on a convergence of multiple independent lines of scientific evidence.
In science and history, consilience (also a convergence of evidence or concordance of evidence) refers to the principle that evidence from independent, unrelated sources can "converge" on strong conclusions. That is, when multiple sources of evidence are in agreement, the conclusion can be very strong even when none of the individual sources of evidence is significantly so on its own. Most established scientific knowledge is supported by a convergence of evidence: if not, the evidence is comparatively weak, and there will not likely be a strong scientific consensus.
The opinion of any single individual scientist is irrelevant. Consensus matters in science. You will find individual scientist who dispute Einsteins Theory of General Relativity and that’s fine. That’s how science works, but the consensus holds until the evidence convinces otherwise.
Den fagfellevurderte literaturen inneholder ingenting som kan erstatte teorien om AGW.
Siste:
At the end of the day, a difference between 97% and 99.94% is probably not going to sway many people who aren’t already convinced. As with smoking, public opinion is slow to follow the science, and the insidious marketing and lobby machine is working at full gear. Just like the tobacco companies knew about the damage that smoking can do, oil companies have been aware of climate change for decades, but continue to fund denier and pro-fossil fuel media.
Selv oljeselskapenes egne eksperter og forskere er nå enig i at våre C02 utslipp forårsaker global oppvarming.
Among abstracts expressing a position on AGW, 97.1% endorsed the consensus position that humans are causing global warming.

Den meget respekterte og Pulitzerpris-vinnende faktasjekkeren Politifact bekrefter den sterke konsensusen: “ We found that there is solid consensus among the major scientific organizations and that the skeptics seems to be small minority “.
En annen respektert faktasjekker, FactCheck.org, er enig: “ There is, in fact, a fairly large consensus — as high as 97 percent based upon multiple studies of varying size, composition and method — that human emissions have been the primary driving force behind observed changes to the climate.”

Men hva med den fagfellevurderte klimavitenskapen som går imot konsensus? Blir disse studiene hørt? Ja. Forskerne ser også på disse, men det viser seg at de ikke holder mål. Her er 38 studier fra de siste 10 årene. 38 studier som går imot den overveldende oppfatningen om at mennesker bidrar til klimaendringer. Alle disse 38 studiene hadde alvorlige feil og mangler. Les om dette her:
But what about those 3% of papers that reach contrary conclusions? The researchers tried to replicate the results of those 3% of papers—a common way to test scientific studies—and found biased, faulty results.Katharine Hayhoe, an atmospheric scientist at Texas Tech University, worked with a team of researchers to look at the 38 papers published in peer-reviewed journals in the last decade that denied anthropogenic global warming.
“Every single one of those analyses had an error—in their assumptions, methodology, or analysis—that, when corrected, brought their results into line with the scientific consensus."
The Guardian følger opp:
Cherry picking was the most common characteristic they shared. We found that many contrarian research papers omitted important contextual information or ignored key data that did not fit the research conclusions.[...] there is no cohesive, consistent alternative theory to human-caused global warming. Some blame global warming on the sun, others on orbital cycles of other planets, others on ocean cycles, and so on.
[...]the 2–3% of papers that reject that consensus are all over the map, even contradicting each other. The one thing they seem to have in common is methodological flaws like cherry picking, curve fitting, ignoring inconvenient data, and disregarding known physics.
If any of the contrarians were a modern-day Galileo, he would present a theory that’s supported by the scientific evidence and that’s not based on methodological errors.
Such a sound theory would convince scientific experts, and a consensus would begin to form. Instead, as our paper shows, the contrarians have presented a variety of contradictory alternatives based on methodological flaws, which therefore have failed to convince scientific experts. Human-caused global warming is the only exception. It’s based on overwhelming, consistent scientific evidence and has therefore convinced over 97% of scientific experts that it’s correct. På hjemmesiden til magasinet Science finner du bortimot 100 000 fagfellevurderte artikler om AGW!
KONKLUSJON: KONSENSUS ER IKKE 97%. DEN ER OVER 99%


“The petition project was a deliberate attempt to mislead scientists and to rally them in an attempt to undermine support for the Kyoto Protocol. The petition was not based on a review of the science of global climate change, nor were its signers experts in the field of climate science"

10. Klimaløgnmakernes taktikker, konspira, junk science, stigmatiserte kunnskap og uærlige budbringere
11. The Great Global Warming Swindle-filmen
12. Klimarealistene
13. Alle klimaløgners mor - Tankesmien The Heartland Institute
14. Tilbake til Klimarealistene
15. PragerU og kreasjonisten bak
16. Klimarealistene anmelder bok
17. Konklusjon så langt
18. Klimafornekting i en konspirasjonskultur
19. Klimafornektingens røtter
20. Klimafornekting fra fossil brensel-industrien og hvordan den kopierer
tobaksindustriens metoder
21. Sponsorene - den enorme pengestøtten bak klimaløgnene og taktikkene som
brukes for å spre dem
22. Krigen mot vitenskapen
23. Kreasjonistene
24. Klima-kreasjonistene
25. Oppsummering
26. Avslutning
27. Bonus.
28. Faktaverktøy / Linker
MYTE #23 METAN, KUFIS OG LANDBRUK
MYTE #24 KLIMAENDRINGENE ØKER IKKE KOSTNADENE MED EKSTREMVÆR
MYTE #25 KLIMAFORSKERNE ER "KJØPT OG BETALT"
MYTH #26 THEY CHANGED THE NAME FROM GLOBAL WARNING TO CLIMATE CHANGE
MYTH #27 WE'RE COMING OUT OF THE LITTLE ICE AGE AND WE'RE HEADING INTO A MINI ICE AGE (LOL)
MYTH #28 WIND TURBINES ARE THE BIRD KILLERS
Sceptical Science, som alltid er oppdatert med den beste klimavitenskapen og som alltid viser til fagfellevurderte rapporter, tar for seg ALLE klimamytene her. Her er og en fin myteknuser-veiledning. Her er one-liner versjonen.

Disse YouTube-videoene oppklarer mange klimamyter effektivt ved hjelp av oppdatert klimavitenskap:
8. ER KONSENSUS 97%?
Det er en del %-tall angående konsensus om AGW som flyter rundt. At konsensus er så overveldende og høy, er på grunn av alle bevisene; på etterprøvbar kunnskap og observasjoner ervervet gjennom den Vitenskapelige Metode. Og ikke minst pga hva grunnleggende fysikk og elementær kjemi forteller oss.
The consensus did not arise from a vote or a gathering. It speaks to the evidence. Scientists come to a consensus after a convergence of evidence leaves no significant doubt about a result. It happens a lot in science. There is a consensus that the speed of light is the universe's speed limit. Scientists didn't vote on that or gather to agree and find evidence to support that agreement. They came to a consensus after the research from multiple independent lines of evidence converged. The same process has taken place in climate science. Scientists didn't vote on the validity of AGW or come together and agree before the evidence came in. They came to a consensus based upon multiple independent lines of evidence converged to support AGW. The consensus among scientists is real, it is not based on popularity or voting, it is based on a convergence of multiple independent lines of scientific evidence.
In science and history, consilience (also a convergence of evidence or concordance of evidence) refers to the principle that evidence from independent, unrelated sources can "converge" on strong conclusions. That is, when multiple sources of evidence are in agreement, the conclusion can be very strong even when none of the individual sources of evidence is significantly so on its own. Most established scientific knowledge is supported by a convergence of evidence: if not, the evidence is comparatively weak, and there will not likely be a strong scientific consensus.
The opinion of any single individual scientist is irrelevant. Consensus matters in science. You will find individual scientist who dispute Einsteins Theory of General Relativity and that’s fine. That’s how science works, but the consensus holds until the evidence convinces otherwise.
Den fagfellevurderte literaturen inneholder ingenting som kan erstatte teorien om AGW.
Siste:
At the end of the day, a difference between 97% and 99.94% is probably not going to sway many people who aren’t already convinced. As with smoking, public opinion is slow to follow the science, and the insidious marketing and lobby machine is working at full gear. Just like the tobacco companies knew about the damage that smoking can do, oil companies have been aware of climate change for decades, but continue to fund denier and pro-fossil fuel media.
Selv oljeselskapenes egne eksperter og forskere er nå enig i at våre C02 utslipp forårsaker global oppvarming.
De fleste av verdens største fossil-brensel selskaper støtter teorien om AGW, er for karbonskatter og ser en fremtid i fornybar energi. Mange av dem er godt i gang med overgangen allerede. Jeg sjekket status for 6 av verdens største her.
BP, verdens 8ende største på olje og gass:
As scientists and engineers, BP recognizes the urgency of the climate challenge - and we intend to be part of the solution. We are calling for a price on carbon, increasing gas in our upstream portfolio, investing in renewables and low carbon innovation, and pursuing energy efficiency.
Verdens nest største, SINOPEC fra Kina:
Climate change is a major global issue for all humankind. As a responsible energy and petrochemical company, Sinopec regards it as its due responsibility to fight against climate change.
STATOIL
The impact of climate change is becoming more severe and noticeable: ice caps are melting, water is becoming scarce in some places, many fish and animal species face extinction, and heat waves are becoming the norm. Verdens nest største, SINOPEC fra Kina:
Climate change is a major global issue for all humankind. As a responsible energy and petrochemical company, Sinopec regards it as its due responsibility to fight against climate change.
STATOIL
Among abstracts expressing a position on AGW, 97.1% endorsed the consensus position that humans are causing global warming.
Mens det i 1991 var rundt 90 prosent av klimaforskningsrapportene som ga klart uttrykk for at klimaendringene var menneskeskapte, hadde tallet økt til 98 prosent i 2011.” Les mer om det her.
Gunnar Tjomlid og hans blogg Saksynt har en fin oppklaring om konsensus her. Også her kan en lese om konsensus. Over 99% nå.
Uansett; Bevismengden er overveldende: At mennesker bidrar til klimaendringer er nå like mye fakta som Den kopernikanske modell, vaksinasjons-prinsippet, evolusjonsteori, platetektonikk og Big Bang teorien, som at røyking øker risikoen for lungesykdommer, som at Jorden er 4,6 milliarder år gammel , som at Jorden er rund, men, selv det er det altså ikke alle som tror.
Forskere og klimaeksperter over hele verden er enige, inkludert 375 av verdens fremste, deriblant 30 Nobelprisvinnere. The Guardian har noen gode poenger.
Every scientific body, org and institusion of the world, every National Academy of Sciences of the world, over 99% of the peer reviewed papers + most oil companies + basic physics ALL agree that AGW theory is a fact.
Every scientific body, org and institusion of the world, every National Academy of Sciences of the world, over 99% of the peer reviewed papers + most oil companies + basic physics ALL agree that AGW theory is a fact.
DET FINNES IKKE EN ENESTE NASJONAL ELLER INTERNASJONAL VITENSKAPELIG INSTITUSJON/org/akademi e.l SOM IKKE STILLER SEG BAK TEORIEN OM MENNESKESKAPT GLOBAL OPPVARMING! IKKE EN ENESTE!
Sjekk og ut Paris-avtalen, der bortimot 200 land har blitt enige om å begrense global oppvarming. Med andre ord, hele verden, akkurat nå, erkjenner menneskeskapt global oppvarming og har begynt å gjøre noe med det.

Den meget respekterte og Pulitzerpris-vinnende faktasjekkeren Politifact bekrefter den sterke konsensusen: “ We found that there is solid consensus among the major scientific organizations and that the skeptics seems to be small minority “.
En annen respektert faktasjekker, FactCheck.org, er enig: “ There is, in fact, a fairly large consensus — as high as 97 percent based upon multiple studies of varying size, composition and method — that human emissions have been the primary driving force behind observed changes to the climate.”
Men hva med den fagfellevurderte klimavitenskapen som går imot konsensus? Blir disse studiene hørt? Ja. Forskerne ser også på disse, men det viser seg at de ikke holder mål. Her er 38 studier fra de siste 10 årene. 38 studier som går imot den overveldende oppfatningen om at mennesker bidrar til klimaendringer. Alle disse 38 studiene hadde alvorlige feil og mangler. Les om dette her:
But what about those 3% of papers that reach contrary conclusions? The researchers tried to replicate the results of those 3% of papers—a common way to test scientific studies—and found biased, faulty results.Katharine Hayhoe, an atmospheric scientist at Texas Tech University, worked with a team of researchers to look at the 38 papers published in peer-reviewed journals in the last decade that denied anthropogenic global warming.
“Every single one of those analyses had an error—in their assumptions, methodology, or analysis—that, when corrected, brought their results into line with the scientific consensus."
The Guardian følger opp:
Cherry picking was the most common characteristic they shared. We found that many contrarian research papers omitted important contextual information or ignored key data that did not fit the research conclusions.[...] there is no cohesive, consistent alternative theory to human-caused global warming. Some blame global warming on the sun, others on orbital cycles of other planets, others on ocean cycles, and so on.
[...]the 2–3% of papers that reject that consensus are all over the map, even contradicting each other. The one thing they seem to have in common is methodological flaws like cherry picking, curve fitting, ignoring inconvenient data, and disregarding known physics.
If any of the contrarians were a modern-day Galileo, he would present a theory that’s supported by the scientific evidence and that’s not based on methodological errors.
Such a sound theory would convince scientific experts, and a consensus would begin to form. Instead, as our paper shows, the contrarians have presented a variety of contradictory alternatives based on methodological flaws, which therefore have failed to convince scientific experts. Human-caused global warming is the only exception. It’s based on overwhelming, consistent scientific evidence and has therefore convinced over 97% of scientific experts that it’s correct. På hjemmesiden til magasinet Science finner du bortimot 100 000 fagfellevurderte artikler om AGW!
KONKLUSJON: KONSENSUS ER IKKE 97%. DEN ER OVER 99%
BONUS: Klimaløgnsprederne elsker å henvise til en liste på over 31 000 navn som visstnok skal bevise at det er en stor uenighet internasjonalt om AGW. La oss se litt nærmere på denne listen, den såkalte Oregon Petition. En av verdens mest pålitelige faktasjekkere, Snopes.com, debunker listen her “ The petition was created by individuals and groups with political motivations, was distributed using misleading tactics, is presented with almost no accountability regarding the authenticity of its signatures, and asks only that you have received an undergraduate degree in any science to sign."
Også den Pulitzer-pris-vinnende faktasjekeren PolitiFact gruser listen her.
Pants on fire er deres nådeløse konklusjon!
Videre, og ikke le nå, “ Careful study of the list revealed the names of fictional characters from the “Star Wars” movies as well as the name of pop singer Geri Halliwell from the “Spice Girls” band.“ En kan jo lure på hvem fra Star Wars som har signert listen. Kan det ha vært Yoda? Han Solo? Var det Jabba The Hut? Bobba Fett? eller selveste Chewbaccha? Personlig har jeg en misstanke om at det kan være Dart Vader. RationalWiki belyser og saken.
I følge Wikipedia er det nøyaktige tallet 39 . Kun 39 av de over 31 000 signaturene på listen er altså klimaforskere. Huffington Post forteller hele historien bak listen her.
9. KAN VI SE KONSEKVENSER AV MENNESKESKAPTE KLIMAENDRINGER NÅ?
Menneskeskapte utslipp har påvirket nedbørsmønstre, varmet opp havet, bidratt til smelting av isbreer og havis i Arktis og tap av innlandsis på Grønland, ifølge FNs klimapanel.
Klimaendringene har allerede påvirket natur og mennesker over hele verden. Endringer i nedbør og smeltende is har for eksempel påvirket tilgangen og kvaliteten på vann mange steder.
Almost 750 million people in South Asia were affected by floods, droughts, extreme rainfall, heat waves and sea-level rise — all impacts of climate change or worsened by it — in the first decade of this millennium, according to new research by the International Water Management Institute.
Afrika. Les mer om konsekvensene her, her, og her
It's Raining in Antarctica While Trump Slashes Climate Science Funding.
Fast-Growing Moss Is Turning Antarctica Green:
Afrika. Les mer om konsekvensene her, her, og her
It's Raining in Antarctica While Trump Slashes Climate Science Funding.
Fast-Growing Moss Is Turning Antarctica Green:

"Matthew Amesbury at the University of Exeter, UK, and his colleagues isolated moss-bank cores dating back 150 years from three sites across the peninsula. They found that since 1950 moss growth and accumulation have increased markedly at all sites. This shift is probably due to the increasing global temperatures associated with climate change."
A team of scientists had to abandon an expedition through Hudson Bay because of hazardous ice conditions off the coast of Newfoundland caused by climate change.[...] Typically when people think about climate change they think about thinning ice, but Barber points out the warming action also loosens ice and broken icebergs can travel long distances on ocean currents. "It's very much a climate-change driven phenomenon," said Barber. "When you reduce the extent of the ice and reduce the thickness of it, it becomes more mobile.[...] "What happens in the Arctic doesn't stay there. It comes south," he said. "We're simply ill-prepared."
Men er klimaendringene katastrofale? Ordet er meningsløst i denne konteksten og implikasjonen at hvis det ikke er "katastrofalt", er det ikke et problem, er det ikke støtte for. Det er rikelig bevis på at nåværende oppvarming allerede har effekt på dyrelivet, og alle større øko-organisasjoner i verden ser det som en stor bekymring. Den generelle konsensus er at hvis oppvarming går over + 2c på preindustrial gjennomsnittet, vil det få alvorlige negative effekter på det biologiske mangfoldet. Mye av dette kommer av forverring av andre problemer som ødeleggelse av levesteder og innvasjon av fremmede arter.
Fns Klimapanel: B: FUTURE RISKS AND OPPORTUNITIES FOR ADAPTATION: Human Risks:
Climate change over the 21st century is projected to increase displacement of people (medium evidence, high agreement).Displacement risk increases when populations that lack the resources for planned migration experience higher exposure to extreme weather events, in both rural and urban areas, particularly in developing countries with low income. Expanding opportunities for mobility can reduce vulnerability for such populations. Changes in migration patterns can be responses to both extreme weather events and longer-term climate variability and change, and migration can also be an effective adaptation strategy. There is low confidence in quantitative projections of changes in mobility, due to its complex, multi-causal nature.
Climate change can indirectly increase risks of violent conflicts in the form of civil war and inter-group violence by amplifying well-documented drivers of these conflicts such as poverty and economic shocks (medium confidence).Multiple lines of evidence relate climate variability to these forms of conflict.
KORALLREVENE. HVA ER STATUS?
En stor studie fra mars 2017:
During 2015–2016, record temperatures triggered a pan-tropical episode of coral bleaching, the third global-scale event since mass bleaching was first documented in the 1980s. Here we examine how and why the severity of recurrent major bleaching events has varied at multiple scales, using aerial and underwater surveys of Australian reefs combined with satellite-derived sea surface temperatures. The distinctive geographic footprints of recurrent bleaching on the Great Barrier Reef in 1998, 2002 and 2016 were determined by the spatial pattern of sea temperatures in each year. Water quality and fishing pressure had minimal effect on the unprecedented bleaching in 2016, suggesting that local protection of reefs affords little or no resistance to extreme heat. Similarly, past exposure to bleaching in 1998 and 2002 did not lessen the severity of bleaching in 2016. Consequently, immediate global action to curb future warming is essential to secure a future for coral reefs.
Key points from the study:
- 2015-2016 saw record temperatures that triggered a massive episode of coral bleaching across the tropics
- Coral bleaching events should no longer be thought of as individual disturbances to reefs, but as recurring events that threaten the viability of coral reefs globally
- The Great Barrier Reef has had three major bleaching episodes, in 1998, 2002 and 2016, with the latest being the most severe and with catastrophic levels of bleaching occurring in the northern third of the Reef (a region approximately 800 km or 500 miles in length)
- The amount of bleaching on individual reefs in 2016 was tightly linked to local heat exposure
- The cumulative, superimposed footprint of the three mass bleaching events on the Great Barrier Reef has now encompassed virtually all of the Great Barrier Reef
- Past exposure to bleaching in 1998 and 2002 did not lessen the severity of the bleaching in 2016
En studie fra 2012:
The 27–year decline of coral cover on the Great Barrier Reef and its causes
En fin oppsummering av klimaendringene.
Her ser vi at “fordelene” med global oppvarming er få og kortsiktige mens ulempene er mange og langsiktige.
10. Klimaløgnmakernes taktikker, konspira, junk science, stigmatiserte kunnskap og uærlige budbringere
11. The Great Global Warming Swindle-filmen
12. Klimarealistene
13. Alle klimaløgners mor - Tankesmien The Heartland Institute
14. Tilbake til Klimarealistene
15. PragerU og kreasjonisten bak
16. Klimarealistene anmelder bok
17. Konklusjon så langt
INNHOLD DEL 4 - HVORDAN ALT ER VEVD SAMMEN
18. Klimafornekting i en konspirasjonskultur
19. Klimafornektingens røtter
20. Klimafornekting fra fossil brensel-industrien og hvordan den kopierer
tobaksindustriens metoder
21. Sponsorene - den enorme pengestøtten bak klimaløgnene og taktikkene som
brukes for å spre dem
22. Krigen mot vitenskapen
23. Kreasjonistene
24. Klima-kreasjonistene
25. Oppsummering
26. Avslutning
27. Bonus.
28. Faktaverktøy / Linker


Ingen kommentarer:
Legg inn en kommentar