I 1998 publiserte Michael E. Mann, Raymond S. Bradley og Malcolm K. Hughes (i fellesskap gjerne kalt MBH) artikkelen «Global-scale temperature patterns and climate forcing over the past six centuries» i Nature. Her viser de en rekonstruksjon av temperaturen på den nordlige halvkula fra 1400. Ei grafisk framstilling av resultatene viser ei svært stor økning i temperaturen i siste halvdel av 1900-tallet, mens det i perioden før dette var mindre variasjoner. Grafen har dermed form som ei liggende ishockeykølle, og den fikk snart tilnavnet hockeykøllegrafen. Året etter publiserte de tre en utvidelse av grafen, som gikk tilbake til år 1000. MBHs hovedfunn er i stor grad bekrefta av seinere forskning.

Her er 5 grunner til at "Kølla" er kommet for å bli:
Here are 5 reasons why the "Stick" is here to stay:
1. Its affirmed by The National Academy Of Science.
Den er bekreftet og godkjent av the National Academy of Sciences
National Academy of Sciences are one of the most respectable scientific academies of the world. They hold a very strong position in the US, all the way back to when it was founded by Abraham Lincoln. As of 2016, the National Academy of Sciences includes about 2,350 members and 450 foreign associates. Approximately 200 members have won a Nobel Prize.

The 4 most comprehensive studies done on the matter confirms and improves the "Stick":
De fire mest omfattende studiene noensinne gjort på dette feltet bekrefter og forbedrer "Kølla":
78 researchers from 24 countries, together with many other colleagues, worked for seven years in the PAGES 2k project on the new climate reconstruction. “2k” stands for the last 2000 years, while PAGES stands for the Past Global Changes program launched in 1991. Recently, their new study was published in Nature Geoscience. It is based on 511 climate archives from around the world, from sediments, ice cores, tree rings, corals, stalagmites, pollen or historical documents and measurements. All data are freely available.
Slik ser køllen ut i IPPC AR4 2007:

3. Planet Earth is warmer than it has been for at least 2,000 years, according to a study that took its temperature from 692 different “natural thermometers” on every continent and ocean on the planet. The database gathers 692 records from 648 locations, including all continental regions and major ocean basins. The records are from trees, ice, sediment, corals, speleothems, documentary evidence, and other archives. They range in length from 50 to 2000 years, with a median of 547 years, while temporal resolution ranges from biweekly to centennial.
4. Using data from 642 sites across North America and Europe, the temperatures they found closely matched those expected from computer simulations. They found that throughout most of the Holocene period (the last ~11,000 years), the Earth was warming very slightly. Only in the last ~2000 years has the Earth been in a cooling period (which probably would have continued except that human emissions of greenhouse gases have now reversed the cooling).
The authors attempted to put the recent warming (last century or so) into context. They found that the recent temperatures are much higher than temperatures over the past 11,000 years. In fact, according to their calculations, 2016 was warmer than 99.41% of all simulated Holocene years.
This finding is profound. First of all, it means that human greenhouse gas emissions were easily able to overturn what should be a natural cooling trend. Second, the warming we have caused is far outside of the natural range.
Slik ser køllen ut i IPPC AR4 2007:
3. Planet Earth is warmer than it has been for at least 2,000 years, according to a study that took its temperature from 692 different “natural thermometers” on every continent and ocean on the planet. The database gathers 692 records from 648 locations, including all continental regions and major ocean basins. The records are from trees, ice, sediment, corals, speleothems, documentary evidence, and other archives. They range in length from 50 to 2000 years, with a median of 547 years, while temporal resolution ranges from biweekly to centennial.
4. Using data from 642 sites across North America and Europe, the temperatures they found closely matched those expected from computer simulations. They found that throughout most of the Holocene period (the last ~11,000 years), the Earth was warming very slightly. Only in the last ~2000 years has the Earth been in a cooling period (which probably would have continued except that human emissions of greenhouse gases have now reversed the cooling).
The authors attempted to put the recent warming (last century or so) into context. They found that the recent temperatures are much higher than temperatures over the past 11,000 years. In fact, according to their calculations, 2016 was warmer than 99.41% of all simulated Holocene years.
This finding is profound. First of all, it means that human greenhouse gas emissions were easily able to overturn what should be a natural cooling trend. Second, the warming we have caused is far outside of the natural range.
______________
Researchers reconstructed temperatures from fossil pollen collected from 642 lake or pond sites across North America -- including water bodies in Wyoming -- and Europe.[...]The reconstructions indicate that evidence of periods that were significantly warmer than the last decade were limited to a few areas of the North Atlantic that were probably unusual globally.
5. A Reconstruction of Regional and Global Temperature for the Past 11,300 Years
Surface temperature reconstructions of the past 1500 years suggest thatrecent warming is unprecedented in that time. Here we provide a broader perspective by reconstructing regional and global temperature anomalies for the past 11,300 years from 73 globally distributed records. Early Holocene (10,000 to 5000 years ago) warmth is followed by ~0.7°C cooling through the middle to late Holocene (<5000 years ago), culminating in the coolest temperatures of the Holocene during the Little Ice Age, about 200 years ago. This cooling is largely associated with ~2°C change in the North Atlantic. Current global temperatures of the past decade have not yet exceeded peak interglacial values but are warmer than during ~75% of the Holocene temperature history. Intergovernmental Panel on Climate Change model projections for 2100 exceed the full distribution of Holocene temperature under all plausible greenhouse gas emission scenarios.Although each of the temperature reconstructions are different (due to differing calibration methods and data used), they all show some similar patterns of temperature change over the last several centuries. Although each of the temperature reconstructions are different (due to differing calibration methods and data used), they all show some similar patterns of temperature change over the last several centuries. Most striking is the fact that each record reveals that the 20th century is the warmest of the entire record, and that warming was most dramatic after 1920.
_________________________________________________________________________
An independent assessment of Mann's hockey stick was conducted by the National Center for Atmospheric Research (Wahl 2007). They reconstructed temperatures employing a variety of statistical techniques (with and without principal components analysis). Their results found slightly different temperatures in the early 15th Century. However, they confirmed the principal results of the original hockey stick - that the warming trend and temperatures over the last few decades are unprecedented over at least the last 600 years.
Since the hockey stick paper in 1998, there have been a number of proxy studies analysing a variety of different sources including corals, stalagmites, tree rings, boreholes and ice cores. They all confirm the original hockey stick conclusion: the 20th century is the warmest in the last 1000 years and that warming was most dramatic after 1920.
RealClimate oppklarer de fire største mytene her.
And yes, the "hockeystick" data is available here:
http://www.meteo.psu.edu/holocene/public_html/Mann/tools/tools.php
BONUS: The Yamal controversy
"Canadian statistics experts" McIntyre and McKitrick. McIntyre at the time was a former mining executive and McKitrick an economist at Guelph University. Although the two garnered a lot of attention with their "analysis" and the harassment of climate scientists, they criticisms of the MBH study are thoroughly discredited. == In fact, the Yamal tree ring dataset was used in only 4 of the 12 reconstructions done by MBH in the first place. A plain English account of the controversy here:
https://rationalwiki.org/wiki/Yamal_controversy
http://www.realclimate.org/index.php/archives/2012/05/yamalian-yawns/
The divergence problem, not to be confused by the Yamal dataset, had to do with the fact that there was a high correlation between temperature and tree ring growth between 1880 and 1960 in certain Alaskan tree ring datasets, but the correlation weakened in the latter part of the 20th century. This was noted by Keith Briffa, THE "B" in MBH in 1998. IOW, it was Mann's group who reported the divergence in the first place. But it was irrelevant to the MBH conclusions because by 1960, there were instrumental records and so proxies were unnecessary.
Finally we get to the most egregious of McIntyre and McKitrick's attacks on climate science. They claimed that their reconstruction of Mann's program generated hockey stick shapes out of random statistical noise. They made this claim to a Congressional subcommittee, which hired a statistician to "replicate" their findings. But:https://deepclimate.org/.../replication-and-due.../
BONUS 2
Unpublished research by university scientists is exempt from the Virginia Freedom of Information Act, the Virginia Supreme Court ruled Thursday, rejecting an attempt by skeptics of global warming to view the work of a prominent climate researcher during his years at the University of Virginia.
https://www.washingtonpost.com/blogs/local/wp/2014/04/17/va-supreme-court-rules-for-u-va-in-global-warming-foia-case/?utm_term=.504be21128f1
[References]
1. Mann ME, Zhang Z, Rutherford S, Bradley RS, Hughes MK, Shindell D, Ammann C, Faluvegi G, and Ni F: Global signatures and dynamical origins of the Little Ice Age and Medieval Climate Anomaly. Science 326(5957):1256–1260, 2009.dx.doi.org/10.1126/science.1177303
2. PAGES 2k Consortium: Continental-scale temperature variability during the past two millennia. Nature Geoscience 6(5):339–346, 2013.dx.doi.org/10.1038/ngeo1797
Jones & Mann 2004 [1] shows how well proxies up to current times (when they're available) can reproduce instrumental temperatures. Unfortunately, most public-domain proxy series don't extend as far as instrumental temps, but when they do, the series generally match up well.
[References]
1. Jones PD and Mann ME: Climate over past millennia. Reviews of Geophysics 42(2):RG2002, 2004. dx.doi.org/10.1029/2003RG000143
Michael Mann Did Not Sabotage His Law Suit, But Deniers Are Sabotaging The Planet
The Hockey Stick and the Climate Wars: The Battle Continues" – the Earth101 lecture:
The Hockey Stick: The Most Controversial Chart in Science, Explained
Climate deniers threw all their might at disproving the famous climate change graph. Here's why they failed.
Sammenlign temperatur-kartet fra 1000 år tilbake - med sine hot spots, med dagens (2016) varmekart.

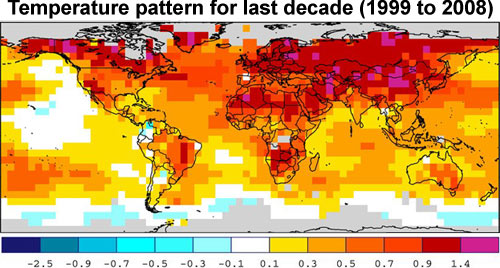
Følgelig, var altså den såkalte MWP regional:
This is a list of paleoclimatologic studies [2–46] that use a variety of temperature proxies and methodologies in affirmation of Michael Mann's hockey stick result [1], which shows strong recent hemispheric and global warming.
1. Mann ME, Bradley RS, and Hughes MK: Global-scale temperature
patterns and climate forcing over the past six centuries. Nature
392(6678):779–787, 1998. dx.doi.org/10.1038/33859
2. Jones PD, Briffa KR, Barnett TP, and Tett SFB: High-resolution palaeoclimatic records for the last millennium: interpretation, integration and comparison with General Circulation Model control-run temperatures. The Holocene 8(4):455–471, 1998. dx.doi.org/10.1191/095968398667194956
3. Pollack HN, Huang S, and Shen, P-Y: Climate change record in
subsurface temperatures: a global perspective. Science 282(5387) 279–281. dx.doi.org/10.1126/science.282.5387.279
4. Mann ME, Bradley RS, and Hughes MK: Northern hemisphere temperatures during the past millennium: inferences, uncertainties, and limitations. Geophysical research letters 26(6):759–762, 1999. dx.doi.org/10.1029/1999GL900070
5. Briffa KR: Annual climate variability in the Holocene: interpreting the message of ancient trees. Quaternary Science Reviews 19(1):87–105, 2000. dx.doi.org/10.1016/S0277-3791(99)00056-6
6. Crowley TJ and Lowery TS: How warm was the medieval warm period? AMBIO: A Journal of the Human Environment 29(1):51–54, 2000. dx.doi.org/10.1579/0044-7447-29.1.51
7. Huang S, Pollack HN, and Shen P-Y: Temperature trends over the past five centuries reconstructed from borehole temperatures. Nature 403(6771):756–758, 2000. dx.doi.org/10.1038/35001556
8. Jones PD, Osborn TJ, and Briffa KR: The evolution of climate over
the last millennium. Science 292(5517):662–667, 2001. dx.doi.org/10.1029/2000JD900617
9. Briffa KR, Osborn TJ, Schweingruber FH, Harris IC, Jones PD, Shiyatov SG, and Vaganov EA: Low-frequency temperature variations from a northern tree ring density network. Journal of Geophysical Research, 106(D3):2929–2941, 2001. dx.doi.org/10.1029/2000JD900617
10. Esper J, Cook ER, and Schweingruber FH: Low-frequency signals in long tree-ring chronologies for reconstructing past temperature variability. Science 295(5563):2250–2253, 2002. dx.doi.org/10.1126/science.1066208
11. Mann ME, Rutherford S, Bradley RS, Hughes MK,
and Keimig FT: Optimal surface temperature reconstructions using terrestrial
borehole data. Journal of Geophysical Research: Atmospheres (1984–2012),
108(D7), 2003. dx.doi.org/10.1029/2002JD002532
12. Mann ME and Jones PD: Global surface temperatures over the past two millennia. Geophysical Research Letters 30(15), 2003. dx.doi.org/10.1029/2003GL017814
13. Briffa KR, Osborn TJ, and Schweingruber FH: Large-scale temperature inferences from tree rings: a review. Global and Planetary Change 40(1):11–26, 2004. dx.doi.org/10.1016/S0921-8181(03)00095-X
14. Pollack HN and Smerdon JE: Borehole climate reconstructions: Spatial structure and hemispheric averages. Journal of Geophysical Research: Atmospheres 109(D11):D11106, 2004. dx.doi.org/10.1029/2003JD004163
15. Huang S: Merging information from different resources for new insight into climate change in the past and future. Geophysical Research Letters 31:L13205, 2004. dx.doi.org/10.1029/2004GL019781
16. Jones PD and Mann ME: Climate over past millennia. Reviews of Geophysics 42(2):RG2002, 2004. dx.doi.org/10.1029/2003RG000143
17. Moberg A, Sonechkin DM, Holmgren K, Datsenko NM, and Karlén W: Highly variable Northern Hemisphere temperatures reconstructed from low-and high-resolution proxy data. Nature 433(7026):613–617, 2005. dx.doi.org/10.1038/nature03265
18. Oerlemans J: Extracting a climate signal from 169 glacier records. Science 308(5722):675–677, 2005. dx.doi.org/10.1126/science.1107046
19. Rutherford S, Mann ME, Osborn TJ, Briffa KR, Jones PD, Bradley RS, and Hughes MK: Proxy-based Northern Hemisphere surface temperature reconstructions: sensitivity to method, predictor network, target season, and target domain. Journal of Climate 18(13):2308–2329, 2005. dx.doi.org/10.1175/JCLI3351.1
20. D'Arrigo R, Wilson R, and Jacoby G: On the long-term context for late twentieth century warming. Journal of Geophysical Research: Atmospheres 111(D3):D03103, 2006. dx.doi.org/10.1029/2005JD006352
21. Osborn TJ and Briffa KR: The spatial extent of 20th-century warmth in the context of the past 1200 years. Science 311(5762):841–844, 2006. dx.doi.org/10.1126/science.1120514
22. Viau AE, Gajewski K, Sawada MC, and Fines P: Millennial-scale temperature variations in North America
during the Holocene. Journal of Geophysical Research: Atmospheres (1984–2012) 111(D9):D09102, 2006. dx.doi.org/10.1029/2005JD006031
23. Hegerl GC, Crowley TJ, Hyde WT, and Frame DJ: Climate sensitivity constrained by temperature reconstructions over the past seven centuries. Nature 440(7087):1029–1032, 2006. dx.doi.org/10.1038/nature04679
24. Smith CL, Baker A, Fairchild IJ, Frisia S, and Borsato A: Reconstructing hemispheric-scale climates from multiple stalagmite records. International journal of climatology 26(10):1417–1424, 2006. dx.doi.org/10.1002/joc.1329
.
25. Juckes MN, Allen MR, Briffa KR, Esper J,
Hegerl GC, Moberg A, Osborn TJ, and Weber SL: Millennial temperature
reconstruction intercomparison and evaluation. Climate of the Past
3(4):591–609, 2007. dx.doi.org/10.5194/cp-3-591-2007
26. Wahl ER and Ammann CM: Robustness of the Mann, Bradley, Hughes reconstruction of Northern Hemisphere surface temperatures: Examination of criticisms based on the nature and processing of proxy climate evidence. Climatic Change 85(1–2):33–69, 2007. dx.doi.org/10.1007/s10584-006-9105-7
26. Wahl ER and Ammann CM: Robustness of the Mann, Bradley, Hughes reconstruction of Northern Hemisphere surface temperatures: Examination of criticisms based on the nature and processing of proxy climate evidence. Climatic Change 85(1–2):33–69, 2007. dx.doi.org/10.1007/s10584-006-9105-7
27. Huang SP, Pollack HN, and Shen P-Y: A late Quaternary climate
reconstruction based on borehole heat flux data, borehole temperature data, and
the instrumental record. Geophysical Research Letters 35(13):L13703,
2008. dx.doi.org/10.1029/2008GL034187
28. Lee TC, Zwiers FW, and Tsao M: Evaluation of proxy-based millennial reconstruction methods. Climate Dynamics 31(2–3):263–281, 2008. dx.doi.org/10.1007/s00382-007-0351-9
29. Mann ME, Zhang Z, Hughes MK, Bradley RS, Miller SK, Rutherford S, and Ni F: Proxy-based reconstructions of hemispheric and global surface temperature variations over the past two millennia. Proceedings of the National Academy of Sciences, 105(36):13252–13257, 2008. dx.doi.org/10.1073/pnas.0805721105
30. Kaufman DS, Schneider DP, McKay NP, Ammann CM, Bradley RS, Briffa KR, Miller GH, Otto-Bleisner BL, Overpeck JT, and Vinther BM: Recent warming reverses long-term Arctic cooling. Science 325(5945):1236–1239, 2009. dx.doi.org/10.1126/science.1173983
31. Tingley MP and Huybers P: A Bayesian algorithm for reconstructing climate anomalies in space and time. Part I: Development and applications to paleoclimate reconstruction problems. Journal of Climate 23(10):2759–2781, 2010. dx.doi.org/10.1175/2009JCLI3015.1
32. Ljungqvist FC: A new reconstruction of temperature variability in
the extra-tropical Northern Hemisphere during the last two millennia.
Geografiska Annaler: Series A, Physical Geography 92(3):339–351, 2010. dx.doi.org/10.1111/j.1468-0459.2010.00399.x
33. Christiansen B and Ljungqvist FC: Reconstruction of the
extratropical NH mean temperature over the last millennium with a method that
preserves low-frequency variability. Journal of Climate 24(23):6013–6034,
2011. dx.doi.org/10.1175/2011JCLI4145.1
34. Ljungqvist FC, Krusic PJ, Brattström G, and Sundqvist HS: Northern Hemisphere temperature patterns in the last 12 centuries. Climate of the Past 8(1):227–249, 2012. dx.doi.org/10.5194/cp-8-227-2012
35. Christiansen B and Ljungqvist FC: The extra-tropical Northern Hemisphere temperature in the last two millennia: reconstructions of low-frequency variability. Climate of the Past 8(2):765–786, 2012. dx.doi.org/10.5194/cp-8-765-2012
36. PAGES 2k Consortium: Continental-scale temperature variability
during the past two millennia. Nature
Geoscience 6(5):339–346, 2013. dx.doi.org/10.1038/ngeo1797
37. Marcott SA, Shakun JD, Clark PU, and Mix AC: A reconstruction of regional and global temperature for the past 11,300 years. Science 339(6124):1198–1201, 2013. dx.doi.org/10.1126/science.1228026
38. Shi F, Yang B, Mairesse A, von Gunten L, Li J, Bräuning A, Yang F, and Xiao X: Northern hemisphere temperature reconstruction during the last millennium using multiple annual proxies. Climate Research 56:231–244, 2013. dx.doi.org/10.3354/cr01156
39. Neukom R, Gergis J, Karoly DJ, Wanner H, Curran M, Elbert J, et al.: Inter-hemispheric temperature variability over the past millennium. Nature Climate Change 4(5):362-367, 2014. dx.doi.org/10.1038/nclimate2174
41. Tierney JE, Abram NJ, Anchukaitis KJ, Evans MN, Giry C, et al.: Tropical sea surface temperatures for the past four centuries reconstructed from coral archives. Paleoceanography 30(3):226–252, 2015. dx.doi.org/10.1002/2014PA002717
.
42. Tingley MP and Huybers P: Heterogeneous warming of Northern Hemisphere surface temperatures over the last 1200 years. Journal of Geophysical Research: Atmospheres 120(9):4040–4056, 2015. dx.doi.org/10.1002/2014JD022506
43. Wilson R, Anchukaitis K, Briffa KR, Büntgen U, Cook E, D'Arrigo R, Davi N, Esper J, Frank D, Gunnarson B, and Hegerl G: Last millennium northern hemisphere summer temperatures from tree rings: Part I: The long term context. Quaternary Science Reviews 134:1–8, 2016. dx.doi.org/10.1016/j.quascirev.2015.12.005
44. Abram NJ, McGregor HV, Tierney JE, Evans MN, McKay NP, Kaufman DS, Thirumalai K, and PAGES 2k Consortium: Early onset of industrial-era warming across the oceans and continents. Nature 536(7617):411–418, 2016. dx.doi.org/10.1038/nature19082
45. Pei Q, Zhang DD, Li J, and Lee HF: Proxy-based Northern Hemisphere temperature reconstruction for the mid-to-late Holocene. Theoretical and Applied Climatology 1–11, 2016. dx.doi.org/10.1007/s00704-016-1932-5
46. Emile-Geay J, McKay NP, Kaufman DS, von Gunten L, Wang J, Anchukaitis KJ, Abram NJ, Addison JA, Curran MA, Evans MN, Henley BJ, et al.: A global multiproxy database for temperature reconstructions of the Common Era. Scientific Data 4:170088, 2017. dx.doi.org/10.1038/sdata.2017.88
And for fun, some large-scale regional hockey sticks:
47. Hanhijärvi S, Tingley MP, and Korhola A: Pairwise comparisons to reconstruct mean temperature in the Arctic Atlantic Region over the last 2,000 years. Climate Dynamics 41(7-8):2039–60, 2013. dx.doi.org/10.1007/s00382-013-1701-4
48. Davi NK, D'Arrigo R, Jacoby GC, Cook ER, Anchukaitis K, Nachin B, Rao MP, and Leland C: A long-term context (931–2005 C.E.) for rapid warming over Central Asia. Quaternary Science Reviews 121:89–97, 2015. dx.doi.org/10.1016/j.quascirev.2015.05.020
49. Luterbacher J, Werner JP, Smerdon JE, Fernández-Donado L, González-Rouco FJ, Barriopedro D, Ljungqvist FC, Büntgen U, Zorita E, Wagner S, and Esper J: European summer temperatures since Roman times. Environmental Research Letters 11(2):024001, 2016. dx.doi.org/10.1088/1748-9326/11/2/024001
50. Gergis J, Neukom R, Gallant AJE, and Karoly DK: Australasian Temperature Reconstructions Spanning the Last Millennium. Journal of Climate 29(15):5365–5392, 2016. dx.doi.org/10.1175/JCLI-D-13-00781.1
51. Jaume-Santero F, Pickler C, Beltrami H, and Mareschal J-C: North American regional climate reconstruction from ground surface temperature histories. Climate of the Past 12(12):2181–94, 2016. dx.doi.org/10.5194/cp-12-2181-2016
A partial list of independently derived 'hockey sticks,' compiled by Jim Milks:
Crowley 2000: Used both his own and Mann et al. (1999)’s hockey sticks to examine the cause of temperature changes over the past 1,000 years. Found that natural forcings could not explain twentieth century warming without the effect of greenhouse gases.
Huang, et al. 2000: Reconstructed global average temperatures since AD 1500 using temperature data from 616 boreholes from around the globe.
Bertrand et al. 2002: Reconstructed solar output, volcanic activity, land use changes, and greenhouse gas concentrations since AD 1000, then computed the expected temperature changes due to those forcings. Compared the computed temperature changes with two independent temperature reconstructions.
Esper et al. 2002: Reconstructed Northern Hemisphere temperatures between AD 800 and AD 2000 using tree ring chronologies.
Cronin et al. 2003: Reconstructed temperatures between 200 BC and AD 2000 around Chesapeake Bay, USA, using sediment core records.
Pollack and Smerdon 2004: Reconstructed global average temperatures since AD 1500 using temperature data from 695 boreholes from around the globe.
Esper et al. 2005: Compared and averaged five independent reconstructions of Northern Hemisphere temperatures from AD 1000 to AD 2000.
Moberg et al. 2005: Combined tree ring proxies with glacial ice cores, stalagmite, and lake sediment proxies to reconstruct Northern Hemisphere temperatures from AD 1 to AD 2000.
Oerlemans 2005: Reconstructed global temperatures from AD 1500 to AD 2000 using 169 glacial ice proxies from around the globe. Rutherford, et al. 2005: Compared two multi-proxy temperature reconstructions and tested the results of each reconstruction for sensitivity to type of statistics used, proxy characteristics, seasonal variation, and geographic location. Concluded that the reconstructions were robust to various sources of error.
D’Arrigo et al. 2006: Reconstructed Northern Hemisphere temperatures between AD 700 and AD 2000 from multiple tree ring proxies using a new statistical technique called Regional Curve Standardization. Concluded that their new technique was superior to the older technique used by previous reconstructions.
Osborn and Briffa 2006: Used 14 regional temperature reconstructions between AD 800 and AD 2000 to compare spatial extent of changes in Northern Hemisphere temperatures. Found that twentieth century warming was more widespread than any other temperature change of the past 1,200 years.
Hegerl et al. 2007: Combined borehole temperatures and tree ring proxies to reconstruct Northern Hemisphere temperatures over the past 1,450 years. Introduced a new calibration technique between proxy temperatures and instrumental temperatures.
Juckes et al. 2007: Combined multiple older reconstructions into a meta-analysis. Also used existing proxies to calculate a new Northern Hemisphere temperature reconstruction.
Wahl and Ammann 2007: Used the tree ring proxies, glacial proxies, and borehole proxies used by Mann et al. (1998, 1999) to recalculate Northern Hemisphere temperatures since AD 800. Refuted the McIntyre and McKitrick criticisms and showed that those criticisms were based on flawed statistical techniques.
Wilson, et al. 2007: Reconstructed Northern Hemisphere temperatures from AD 1750 to AD 2000 using tree ring proxies that did not show a divergence problem after AD 1960.
Mann et al. 2008: Reconstructed global temperatures between AD 200 and AD 2000 using 1,209 independent proxies ranging from tree rings to boreholes to sediment cores to stalagmite cores to Greenland and Antarctic ice cores.
Kaufman, et al. 2009: Used tree rings, lake sediment cores, and glacial ice cores to reconstruct Arctic temperatures between 1 BC and 2000 AD.
von Storch et al. 2009: Tested three different temperature reconstruction techniques to show that the Composite plus Scaling method was better than the other two methods.
Frank et al. 2010: A brief history of proxy temperature reconstructions, as well as analysis of the main questions remaining in temperature reconstructions.
Kellerhals et al. 2010: Used ammonium concentration in a glacial ice core to reconstruct tropical South American temperatures over the past 1,600 years.
Ljungqvist 2010: Reconstructed extra-tropical Northern Hemisphere temperatures from AD 1 to AD 2000 using historical records, sediment cores, tree rings, and stalagmites.
Thibodeau et al. 2010: Reconstructed temperatures at the bottom of the Gulf of St. Lawrence since AD 1000 via sediment cores.
Tingley and Huybers 2010a, 2010b: Used a Bayesian approach to reconstruct North American temperatures.
Büntgen et al. 2011: Used tree ring proxies to reconstruct Central European temperatures between 500 BC and AD 2000.
Kemp et al. 2011: Reconstructed sea levels off North Carolina, USA from 100 BC to AD 2000 using sediment cores. They also showed that sea levels changed with global temperature for at least the past millennium.
Kinnard et al. 2011: Used multiple proxies to reconstruct late summer Arctic sea ice between AD 561 and AD 1995, using instrumental data to extend their record to AD 2000.
Martin-Chivelet et al. 2011: Reconstructed temperatures in the Iberian Peninsula from 2000 BC to AD 2000 using stalagmites. Spielhagen et al. 2011: Reconstructed marine temperatures in the Fram Strait from 100 BC to AD 2000 using sediment cores.
Esper et al. 2012: Used tree ring proxies to reconstruct Northern Scandinavian temperatures 100 BC to AD 2000. May have solved the post-AD 1960 tree ring divergence problem.
Ljungqvist et al. 2012: Used a network of 120 tree ring proxies, ice core proxies, pollen records, sediment cores, and historical documents to reconstruct Northern Hemisphere temperatures between AD 800 and AD 2000, with emphasis on proxies recording the Medieval Warm Period.
Melvin et al. 2012: Reanalyzed tree ring data for the Torneträsk region of northern Sweden.
Abram et al. 2013: Reconstructed snow melt records and temperatures in the Antarctic Peninsula since AD 1000 using ice core records.
Marcott, et al. 2013: Reconstructed global temperatures over the past 11,000 years using sediment cores. Data ended at AD 1940.
PAGES 2k Consortium 2013: Used multiple proxies (tree rings, sediment cores, ice cores, stalagmites, pollen, etc) to reconstruct regional and global temperatures since AD 1.
Rhodes et al. 2013: Used proxy and instrumental records to reconstruct global temperatures from AD 1753 to AD 2011.
Y Zhang et al. 2014: "Millennial minimum temperature variations in the Qilian Mountains, China: evidence from tree rings," Climate of the Past, 10, 1763–1778, 2014.
Shi et al. 2015: "A multi-proxy reconstruction of spatial and temporal variations in Asian summer temperatures over the last millennium," Climate Change, August 2015, Volume 131, Issue 4, pp 663-676.
Had enough hockey studies yet? Also check Wikipedia:
https://en.wikipedia.org/wiki/List_of_large-scale_temperature_reconstructions_of_the_last_2,000_years
Had enough hockey studies yet? Also check Wikipedia:
https://en.wikipedia.org/wiki/List_of_large-scale_temperature_reconstructions_of_the_last_2,000_years
BONUS
The Hockey Stick and the Climate Wars: Dispatches from the Front Lines

The ongoing assault on climate science in the United States has never been more aggressive, more blatant, or more widely publicized than in the case of the Hockey Stick graph―a clear and compelling visual presentation of scientific data, put together by MichaelE. Mann and his colleagues, demonstrating that global temperatures have risen in conjunction with the increase in industrialization and the use of fossil fuels. Here was an easy-to-understand graph that, in a glance, posed a threat to major corporate energy interests and those who do their political bidding. The stakes were simply too high to ignore the Hockey Stick―and so began a relentless attack on a body of science and on the investigators whose work formed its scientific basis.
The Hockey Stick achieved prominence in a 2001 UN report on climate change and quickly became a central icon in the "climate wars." The real issue has never been the graph's data but rather its implied threat to those who oppose governmental regulation and other restraints to protect the environment and planet. Mann, lead author of the original paper in which the Hockey Stick first appeared, shares the story of the science and politics behind this controversy. He reveals key figures in the oil and energy industries and the media frontgroups who do their bidding in sometimes slick, sometimes bare-knuckled ways. Mann concludes with the real story of the 2009 "Climategate" scandal, in which climate scientists' emails were hacked. This is essential reading for all who care about our planet's health and our own well-being.
Dr. Mann's book is a fascinating documentation of the attacks by climate deniers who seem threatened by real scientists, conducting real research, and then providing the results of that research to us. The book contains climate science, for sure, but the real purpose of the book is not to present more information on how and why the planet is heating up. It's really a documentation of all the attacks Dr. Mann has endured. If you read the reviews from people who gave this book one or two stars, it's clear that many of them either hadn't read the book or didn't understand what the book was about. This book reads like a whodunit thriller. I simply could not put it down. It was hard for me to believe the lengths that global warming deniers would go to simply because they disagreed with the scientific conclusions by one of our country's premier climate scientists. Those one and two star reviews really show how poorly we are teaching science at the grade school and high school level.
The Madhouse Effect: How Climate Change
Denial Is Threatening Our Planet, Destroying Our Politics, and Driving Us Crazy

The award-winning climate scientist Michael E. Mann and the Pulitzer Prize–winning political cartoonist Tom Toles have been on the front lines of the fight against climate denialism for most of their careers. They have witnessed the manipulation of the media by business and political interests and the unconscionable play to partisanship on issues that affect the well-being of billions. The lessons they have learned have been invaluable, inspiring this brilliant, colorful escape hatch from the madhouse of the climate wars.
The Madhouse Effect portrays the intellectual pretzels into which denialists must twist logic to explain away the clear evidence that human activity has changed Earth's climate. Toles's cartoons collapse counter-scientific strategies into their biased components, helping readers see how to best strike at these fallacies. Mann's expert skills at science communication aim to restore sanity to a debate that continues to rage against widely acknowledged scientific consensus. The synergy of these two climate science crusaders enlivens the gloom and doom of so many climate-themed books―and may even convert die-hard doubters to the side of sound science.
BONUS 2
See this picture?

You'll find this diagram misrepresentated a million places in denier-land. Here is the story behind it: Its only a shematic, a chart, an estimate based on one (1) location in central England, and stopping in 1950, long before the last 30 years of dramatic rise in temperature, and consequently have nothing to do WITH GLOBAL WARMING. The diagram thus does not show that it was warmer in the world during the so-called "Medieval Warm period". (It is warmer on the planet today.) When IPPC later came up with its NEWER graphs about global warming and the famous Hockey stick, they did NOT wipe out the MWP, they just finally used global data (from the northern hemisphere), NOT the regional data from this now outdated and misused diagram. Learn the difference between local weather and GLOBAL warming.
The original global temperature schematic which appeared in the IPCC First Assessment Report and seemed to show the Medieval Warm Period (MWP) hotter than Present was based on the central England temperature record, and ended in the 1950s. It was only a schematic, and based on one isolated geographic location.
Michael Mann info:
Michael Mann, Climate Scientist, Author of "Dire Predictions" & "The Hockey Stick and the Climate Wars" - just won the American Association for the Advancement of Science Award for Public Engagement with Science. He is a Distinguished Professor of Atmospheric Science at Penn State, with a doctorate from Yale University in Geology and Geophysics. He also holds joint appointments in the Department of Geosciences and the Earth and Environmental Systems Institute (EESI). He is also director of the Penn State Earth System Science Center (ESSC).
He received his undergraduate degrees in Physics and Applied Math from the University of California at Berkeley, an M.S. degree in Physics from Yale University, and a Ph.D. in Geology & Geophysics from Yale University. Current areas of research include model/data comparisons aimed at understanding the long-term behavior of the climate.
Dr. Mann was a Lead Author on the Observed Climate Variability and Change chapter of the Intergovernmental Panel on Climate Change (IPCC) Third Scientific Assessment Report in 2001 and was organizing committee chair for the National Academy of Sciences Frontiers of Science in 2003. He has received a number of honors and awards including NOAA's outstanding publication award in 2002 and selection by Scientific American as one of the fifty leading visionaries in science and technology in 2002. He contributed, with other IPCC authors, to the award of the 2007 Nobel Peace Prize. He was awarded the Hans Oeschger Medal of the European Geosciences Union in 2012 and was awarded the National Conservation Achievement Award for science by the National Wildlife Federation in 2013. He made Bloomberg News’ list of fifty most influential people in 2013. In 2014, he was named Highly Cited Researcher by the Institute for Scientific Information (ISI) and received the Friend of the Planet Award from the National Center for Science Education. He received the Stephen H. Schneider Award for Outstanding Climate Science Communication in 2017. He is a Fellow of the American Geophysical Union, the American Meteorological Society, and the American Association for the Advancement of Science. He is also a co-founder of the award-winning science website RealClimate.org.
Dr. Mann is author of more than 200 peer-reviewed and edited publications, and has published three books including Dire Predictions: Understanding Climate Change, The Hockey Stick and the Climate Wars and most recently, The Madhouse Effect with Washington Post editorial cartoonist Tom Toles.
Awards
2018: Award for Public Engagement with Science, American Association for the Advancement of Science (AAAS).
2018: Elected Fellow of the Committee for Skeptical Inquiry, Center for Skeptical Inquiry.
2017: Stephen H. Schneider Award for Outstanding Climate Science Communication from Climate One.
2017: Honorary Doctorate of Science from Green Mountain College
2016: Elected Vice Chair, Topical Group on Physics of Climate (GPC), American Physical Society (APS)
2015: Elected Fellow of the American Association for the Advancement of Science
2015: Honorary Doctorate of Humane Letters, Le Moyne College
https://twitter.com/i/notifications
2015: Business Insider list of 50 “scientists who are changing the way we see the world”
2014: Economia Magazine list of 50 Leading Finance Leaders, Influencers and Innovators
2014: Pongo Award, Orang Utan Republik Foundation
2014: Named Highly Cited Researcher, Institute for Scientific Information (ISI)
2014: Friend of the Planet Award, National Center for Science Education.
2013: National Conservation Achievement Award, National Wildlife Federation
2013: Bloomberg News list of 50 Most Influential People
2013: Elected Fellow of the American Meteorological Society
2012: Elected Fellow of the American Geophysical Union
2012: Hans Oeschger Medal, European Geosciences Union
2011: Elected Member-at-Large of Section W (Atmospheric & Hydrospheric Sciences), American Association for the Advancement of Science (AAAS)
2008: Profiled in American Environmental Leaders From Colonial Times to the Present
2008: Website “RealClimate.org
2007: Contributed, with other IPCC authors, to the award of the 2007 Nobel Peace Prize.
2006: American Geophysical Union Editors’ Citation for Excellence in Refereeing (for ‘Geophysical Research letters’)
2005: Website “RealClimate.org
2005: John Russell Mather Paper award for 2005 by the Association of American Geographers [for article: Frauenfeld, O., Davis, R.E., and Mann, M.E., A Distinctly Interdecadal Signal of Pacific Ocean-Atmosphere Interaction, Journal of Climate 18, 1709-1718, 2005]
2002: Named by Scientific American as one of 50 leading visionaries in science and technology
2002: Outstanding Scientific Paper award for 2002 by NOAA Office of Oceanic and Atmospheric Research (OAR) [for article: Delworth, T.L., Mann, M.E., Observed and Simulated Multidecadal Variability in the Northern Hemisphere, Climate Dynamics, 16, 661-676, 2000]


Ingen kommentarer:
Legg inn en kommentar